Smart Connections Visualizer

by Evan Moscoso
5
4
3
2
1
Score: 58/100

Description

Category: Data Visualization

The Smart Connections Visualizer plugin enhances note navigation in Obsidian by creating an interactive, force-directed graph to visualize connections between notes and blocks. The dynamic layout emphasizes relevance by displaying closer nodes for stronger relationships, aiding in discovering new insights. Users can preview note content by hovering over nodes, adjust visualization parameters like node size, label visibility, and link strength, and interact with the graph using zoom, pan, and hover features. This tool integrates seamlessly with the Smart Connections plugin, offering a unique and efficient way to explore interconnected information. Ideal for those seeking to visualize and enhance their note-taking experience.

Reviews

No reviews yet.

Stats

123
stars
32,325
downloads
15
forks
695
days
123
days
123
days
8
total PRs
0
open PRs
0
closed PRs
8
merged PRs
19
total issues
7
open issues
12
closed issues
139
commits

Latest Version

4 months ago

Changelog

Update to work with Smart Connections 4.0

README file from

Github

Smart Connections Visualizer v1.0

Visualizer

Welcome to the Smart Connections Visualizer Plugin! This plugin integrates seamlessly with the Smart Connections tool, offering an advanced, interactive way to visualize connections between your notes. My goal is to enhance your ability to discover relationships and insights within your notes, transforming the way you interact with and understand your information.

Watch the Demo

Install Smart Connections Visualizer

App Demo

UPDATE

This displays connections for a single note. If you'd like to visualize clusters between multiple notes or all within your entire vault, check out Smart Connections Vault Visualizer

Features

  • Dynamic Force-Directed Graph: Visualize connections as a force-directed graph where nodes represent notes or specific excerpts from them and edges represent connections.
  • Easily view more relevant connections: The distances between nodes and the central node (currently viewed note) are proportional to the relevance of the connections. The closer the distance to the main node, the more relevant the connection is. You can also adjust min and mx width of links to better distinguish these notes/blocks based on relevance.
  • Adjustable Visualization Settings: Customize node size, label size, and text fade distance and more to tailor the visualization to your preferences.
  • Previewing Notes: Ability to see note previews in the visualization view when hovering over a node.
  • Customizable Forces: Adjust the repel force, link force, and center force for a more personalized layout.

Installation

Getting started with the Smart Connections Visualizer Plugin is easy. Follow these steps to install and integrate it with your Smart Connections setup:

  1. Install & Configure Smart Connections Plugin: Ensure you have the Smart Connections plugin installed and all set up in your Obsidian environment.
  2. Install Smart Connections Visualizer Plugin: Download and install the Smart Connections Visualizer Plugin from the Obsidian Community Plugins.

Usage

Once installed, the Smart Connections Visualizer Plugin provides an intuitive interface to explore your notes' connections.

Opening the Visualizer

To open the Visualizer View:

  1. Select the ribbon icon to the left that will display "Smart Connections Visualizer"
  2. The visualization pane will appear.
  3. Select a note and you'll see a dynamic force-directed graph of that note and its connections displayed.

Interacting with the Visualization

  • Zooming: Use the mouse wheel or touchpad to zoom in and out of the view.
  • Panning: Click and drag the visualization to move it around.
  • Hovering: Hover over nodes to highlight them - displaying the full node label and link label, which right now the link label displays the relevance score.
  • Previewing Notes: When hovering over a node, press the Ctrl (Command for Mac) key to view a preview of the note or block that the node represents.

Preview

Customizing the Visualization

Access the settings menu by clicking the gear icon in the top right corner of the visualization pane. Here, you can adjust various parameters:

  • Minimum Relevance: Adjust the slider to change the minimum relevance score needed for displaying connections.
  • Connection Type: Choose whether to display connections by block, or by note.
  • Node Size: Change the size of the nodes to make them more visible or to declutter the visualization.
  • Maximum Label Characters: Define the maximum number of characters displayed on node labels before they truncate/are shortened. Note: hovering over a node will display the full node label.
  • Minimum Link Thickness: Set the minimum thickness for the links. Helps to distinguish between less relevant connections.
  • Maximum Link Thickness: Set the maximum thickness for the links. Helps to distinguish between less relevant connections.
  • Link Label Size: Change the font size of the link labels. Note: Link label will display when hovering over a node.
  • Node Label Size: Adjust the font size of the node labels.
  • Text Fade Threshold: Set the zoom level at which labels fade in and out.
  • Repel Force: Adjust the force that pushes nodes apart.
  • Link Force: Modify the strength of the links between nodes.
  • Link Distance: Adjust the distance between connected nodes - relevance distance will increase/decrease proportionally.

Vision

The text communication format between humans and AI (including other humans) is incredibly inefficient. I believe data visualization tools like this will not only exponentially enhance our ability to communicate with AI but also create a new discovery and decision-making process that will transform how we approach virtually everything. Our brains can't physically retain all the information and use logic to solve our more complex problems simultaneously. Having all the information in the form of text that's neatly scattered across different notes and folders helps, but is nowhere near sufficient. We need to offload this information into a visualization to save our progress and pick up where we left off.

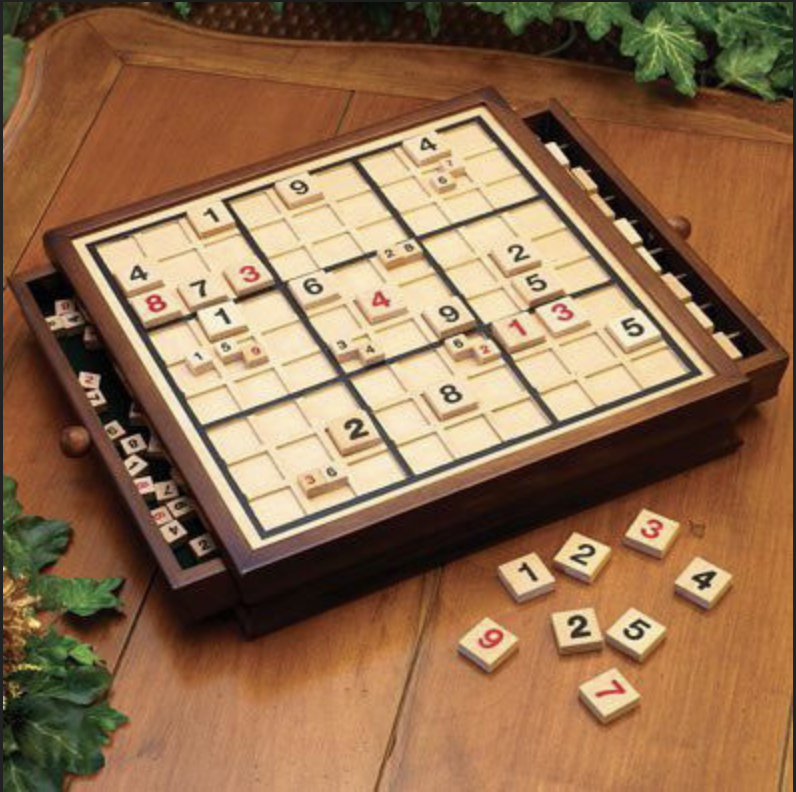
Imagine solving a Sudoku puzzle without a board. That's what we're doing right now when communicating, arguing, and solving problems. You have to memorize all the factors in the starting position, all the moves you make, all the relationships that change with every single move, and so on.. For the complex problems/puzzles we have in life, imagine the difference in our ability to solve them WITH the board. The puzzle is there– we just haven't made the board for it yet!

Sudoku

With this plugin, I envision a future where note-taking, whether text or voice, doesn't get lost. I struggle with maintaining a strict note-taking structure, and things often fall through the cracks. This challenge, combined with my obsession, drives me to create this plugin. While it's not perfect yet, it's a promising start and could improve significantly with your help :) I can hear the music.. and I'm excited to see who else can too!

The ultimate mission is to move away from text-based organization and instead visualize information in a dynamic, context-driven state. As you add more notes, the state updates in a single visualization, showing how new information impacts the old through various relationships (e.g., supportive vs. contradictory statements). This approach eliminates the need for separate folders, as everything is interconnected and builds on top of each other.

I believe this will also solve the "hallucination" problem with AI. By using a visualization as the saved state/knowledge base/memory, we ensure the AI always has the correct context that both you and the AI have worked on and, importantly, that you have approved.

The goal is to see everything you couldn't see before and observe how updating information cascades and affects all other connections. We're on the brink of exponentially increased problem-solving capabilities through visualizing our text-based information, and the possibilities are endless! I've been dedicating a lot of time to this project alongside my other jobs, so any support would be greatly appreciated to allow me more time to keep going :)

About Me

Hello there! Name's Evan :D

I'm a senior software developer/architect consultant, currently managing and developing data visualization tools for the CDC. I've been obsessed about what's transpiring with AI for the last 12-ish years, fully aware that it would soon completely change the world.

Inspired by Brian, the creator of Smart Connections, I started an AI consulting company called "Evan's Oasis." At Evan's Oasis, I audit business workflows for clients and recommend AI tools and practices that significantly enhance decision-making, productivity, and quality—while reducing the time and money needed to run a business.

I've been actively sharing my knowledge by giving webinars to both General Dynamics and the CDC on the most significant AI updates, as well as hosting in-person seminars for the local community. One of my life's main questlines is to inspire people to take advantage of the outragoues new capabilities we have with AI and to show how these tools can assist us in our everyday lives.

TLDR: I was born for this.

In addition to my passion for AI, I'm also developing a device that allows people to control technology using motion capture of their tongue—effectively giving us a fifth limb for universal, hands-free remote control. And don't worry, you won't be moving your tongue around with your mouth open; you can keep your mouth completely closed, and it looks like mind control. We're hoping this device will do wonders for those with physical limitations who can't use technology as effectively. We are currently in the funding phase but have developed several functional prototypes. You can find out more at Glosdex.com

Community and Support

Your involvement is crucial to the evolution of Smart Connections Visualizer. From troubleshooting issues to suggesting new features, every contribution enriches our community and drives the project forward!

Join The Community

  • GitHub Discussions: Participate in discussions on GitHub to share your experiences and ask questions.
  • Contribute: Help develop the plugin, report issues, or suggest new features.
  • User Testimonials: Share how the plugin has impacted your workflow and creativity.

Acknowledgements

Special thanks to Brian, the developer behind Smart Connections.

License

The Smart Connections Visualization Plugin is open-source and available under the MIT License. Contributions are welcome!


Feel free to reach out with any questions or suggestions. I hope this plugin enhances your note-taking experience and helps you uncover new insights and connections within your notes. Happy visualizing!

Similar Plugins

info
• Similar plugins are suggested based on the common tags between the plugins.
3D Graph
3 years ago by Alexander Weichart
👓 A 3D graph for Obsidian!
Adamantine Pick
3 years ago by Urist McMiner
Embeddable Pikchr(https://pikchr.org) diagrams renderer plugin for Obsidian(https://obsidian.md)
Advanced Canvas
2 years ago by Developer-Mike
⚡ Supercharge your canvas experience! Graph view integration and unlimited styling options empower flowcharts, dynamic presentations, and interconnected knowledge.
Advanced Progress Bars
a year ago by cactuzhead
Obsidian plugin to create custom progress bars
Alfonso Money Manager
2 years ago by SmartLifeGPT Innovation
This is the repository for the obsidian plugin of the Alfonso Money Manager mobile application
Argument Map with Argdown
5 years ago by amdecker
Arrows
2 years ago by artisticat
Draw arrows across different parts of your notes, similar to on paper
ASCII Tree Generator
a year ago by Matěj Michálek
BattleSnake Board Viewer
3 years ago by EnderInvader
Plugin to render battlesnake boards in Obsidian
Boardgame Search
a year ago by Marlon May
A plugin to create notes for boardgames based on the BGG API
Breadcrumbs
5 years ago by SkepticMystic
Add typed-links to your Obsidian notes
Canvas Connect
10 months ago by camadkins
Dynamically optimize connection anchors in Obsidian Canvas view
Canvas Explorer
2 years ago by Henri Jamet
A plugin that enables users to explore their vault by iteratively adding or ignoring linked notes, ultimately generating a customizable canvas that visually represents the preserved notes and their connections.
Canvas Filter
3 years ago by Ivan Koshelev
Obsidian Canvas plugin that let's you show only pages / arrows with specific tags / colors / connections.
Canvas Links
3 years ago by aqav
Show the links between "Canvas" and "File"
Canvas Mindmap Helper
2 years ago by Tim Smart
CardNote
2 years ago by cycsd
Help you extract your thoughts more quickly in canvas
Charts View
5 years ago by caronchen
Data visualization solution in Obsidian, support plots and graphs.
Chemical Structure Renderer
3 years ago by xaya1001
Render chemical structures from SMILES strings into PNG or SVG format using Ketcher and Indigo Service.
Chessboard Viewer
5 years ago by Davide Aversa
Plugin to render chessboards in Obsidian using chessboardjs
Class Relation Visualization
a year ago by Yong
Connections
4 months ago by Eric Van Cleve
Content Cards
a year ago by leo
Insert content cards in Markdown, such as timeline, highlightblock, target card, book information card, music information card, movie information card, photoes ablum, business card, content subfield, countdown, SWOT,BCG.
Contribution Graph
2 years ago by vran
generate interactive gitxxx style contribution graph for obsidian, use it to track your goals, habits, or anything else you want to track.
D2
3 years ago by Terrastruct
The official D2 plugin for Obsidian. D2 is a modern diagram scripting language thats turns text to diagrams.
Desk
2 years ago by David Landry
A desk for obsidian
Desmos
4 years ago by Nigecat
Embed graphs directly into your obsidian notes
Diagrams.Net
4 years ago by Jens M Gleditsch
This repository contains a plugin for Obsidian for inserting and editing diagrams.net (previously draw.io) diagrams.
Dirtreeist
3 years ago by kasahala
Render a directory Structure Diagram from a markdown lists in codeblock.
Easy Timeline
a year ago by Romeliun
The Easy Timeline plugin for Obsidian allows you to create timelines easily.
Enhanced Canvas
a year ago by RobertttBS
When editing on Canvas, properties and Markdown links to notes are automatically updated, enabling backlinks in Canvas.
Every Day Calendar
a year ago by QuBe
Obsidian plugin to create calendars inspired by Simone Giertz's Every Day Calendar
Excalidraw
5 years ago by Zsolt Viczian
A plugin to edit and view Excalidraw drawings in Obsidian
Export Graph View
a year ago by Sean McGhee
Plugin to export your vault's graph view.
Extended File Support
a year ago by Nick de Bruin
Adds opening and embedding support for various filetypes to Obsidian
Extended Graph
a year ago by Kapirklaa
Community plugin to add features to the graph view.
Flowcharts
a year ago by land0r
Flowchart Plugin for Obsidian – Create and customize flowcharts seamlessly within your Obsidian vault. Powered by Flowchart.js and designed for productivity
Folder Canvas
a year ago by Nancy Lee
Generate a canvas view of your folder structure
Function Plot
4 years ago by leonhma
A obsidian.md plugin for rendering maths graphs.
Generate Timeline
a year ago by Shanshuimei
An obsidian plugin to generate timelines from tags, folders, files or metadata automatically. 根据标签,文件夹,文件或者属性自动生成时间轴的插件。
GLSL Viewer
3 months ago by iY0Yi
Preview GLSL shaders on Obsidian.
GoBoard
4 months ago by Dmitry I. Sokolov
Obsidian plugin for rendering Go game diagrams from markdown code blocks
Graph Analysis
5 years ago by SkepticMystic & Emile
Analyse the structure of your Obsidian graph using various analysis techniques
Graph Banner
2 years ago by ras0q
An Obsidian plugin to display a relation graph view on the note header.
Graph Link Types
2 years ago by natefrisch01
Link types for Obsidian graph view.
Graphs
2 years ago by Dylan Hojnoski
Plugin for Obsidian that renders interactive graphs from YAML.
Habit Tracker
5 years ago by duo
This plguin for Obsidian creates a simple month view for visualizing your punch records.
Habit Tracker
4 years ago by David Moeller
A Plugin to display a Habit Tracker in Obsidian.
Heatmap Calendar
4 years ago by Richard Slettevoll
An Obsidian plugin for displaying data in a calendar similar to the github activity calendar
Heatmap Tracker
a year ago by Maksim Rubanau
A customizable heatmap tracker plugin for Obsidian to visualize daily data trends with intuitive navigation and flexible settings.
historica
2 years ago by Nhan Nguyen
Not (smart) to help you create your timeline in obsidian like a ... bro
InfraNodus AI Graph View
2 years ago by Nodus Labs
Advanced graph view for Obsidian: text analysis, topic modeling, and AI with InfraNodus AI text analysis tool: https://infranodus.com
Inline Local Graph
3 months ago by TKOxff
Inline Local Graph of Obsidian
Juggl
5 years ago by Emile van Krieken
An interactive, stylable and expandable graph view for Obsidian. Juggl is designed as an advanced 'local' graph view, where you can juggle all your thoughts with ease.
Kale Graph
a year ago by Oli
Render mathematical graphs in Obsidian
Laws of Form
3 years ago by Kevin German
Life in Weeks Calendar
6 months ago by Jeff Szuc
Plugin for the Obsidian markdown editor. Displays a calendar of your life in weeks with weekly Periodic Notes plugin integration. Includes options for the traditional Memento Mori/Stoic style calendar, as well as a Gregorian calendar accurate version.
Lilypond
3 years ago by DOT-ASTERISK
Lilypond for Obsidian
Lineup Builder
4 years ago by James Fallon
An Obsidian plugin that lets you build football lineups
Link Exploder
3 years ago by Ben Hughes
Living Graph
4 years ago by Garrett
Magic Move
2 years ago by imfenghuang
Animating Code Blocks in Obsidian
Mahgen Renderer
a year ago by Michael Francis Williams
Obsidian plugin to render mahgen automatically
Mahjong Renderer
2 years ago by hypersphere
Map View
5 years ago by esm
Interactive map view for Obsidian.md
Mapbox Location Image
2 years ago by Aaron Czichon
Render a mapbox location image based on provided coordinates
Maps
7 months ago by Obsidian
Map layout for Obsidian Bases. Display your notes as an interactive map view.
Markline
2 years ago by 闲耘
Markline: Markdown timeline view in Obsidian.
Markmind
5 years ago by Mark
A mind map, outline for obsidian,It support mobile and desktop
Mathematica Plot
2 years ago by Marcos Nicolau
Insert functions on Obsidian using Wolfram Mathematica!
Mehrmaid
2 years ago by huterguier
Rendering Obsidian Markdown inside Mermaid diagrams.
Mermaid Icons
3 months ago by toshs
Obsidian plugin enabling the use of icons in Mermaid diagrams.
Mindmap
2 years ago by YunXiaoYi
An Obsidian plugin for creating Mindmaps.
Neo4j Graph View
5 years ago by Emile van Krieken
Nested tags graph
3 years ago by drpilman
A small plugin for Obsidian that links nested tags in graph view
New 3D Graph
10 months ago by Aryan Gupta
Visualize your vault in 3D with a powerful, highly customizable, and filterable graph.
Nifty Links
3 years ago by x-Ai
Generating elegant, Notion-styled rich link cards to enhance your note-taking experience.
Node Factor
a year ago by CalfMoon
Customize factors effecting node size in obsidian graph.
NodeFlow
a year ago by LincZero
Render node streams like `ComfyUi`, `UE`, `Houdini`, `Blender`, etc., to make it easy to write relevant notes. json describes the chart, compared to screenshots, making it easier to modify later. The plugin is also compatible with blogs.",
Note Gallery
2 years ago by Pash Shocky
A masonry note gallery for obsidian.
NyanBar
2 years ago by xhyabunny
Give life to your Obsidian notes with NyanBar !
Obsidian Graphviz
4 years ago by Feng Peng
Graphviz plugin for obsidian md.
Optimize Canvas Connections
3 years ago by Félix Chénier
An Obsidian plugin that declutters a canvas by reconnecting notes using their nearest edges
Path Finder
4 years ago by jerrywcy
A plugin that can find the paths between two notes. Not sure who will want to use it...
Persistent Graph
4 years ago by Sanqui
An Obsidian plugin for saving and restoring the positions of nodes on the global graph view
Plot Vectors and Graphs
2 years ago by Nicole Tan YiTong
Obsidian Plugin to generate graphs given the function.
Poker Range
2 years ago by marplek
Easily create, view, and interact with poker hand ranges in your obsidian.
Release Timeline
4 years ago by cakechaser
Sankey
a year ago by Finn Romaneessen
An Obsidian plugin to create sankey diagrams
ShaahMaat-md
a year ago by Mihail Kovachev
Show Whitespace
2 years ago by Erin Schnabel
Show leading/trailing whitespace
Smart Vault Visualizer
a year ago by Evan Moscoso
Storyclock Viewer
2 years ago by Jonathan Fisher
Obsidian plugin for creating a storyclock
Sync Graph Settings
3 years ago by Xallt
This is a plugin for syncing graph settings (Color Groups and Search Filters) to Local Graphs
Tagvis
a year ago by Mason Bryant
Tasks Map
7 months ago by NicoKNL
A graph view of your tasks.
Tier List
a year ago by Mox Alehin
Obsidian plugin for visual ranking and organizing content into customizable Tier Lists.
Timelive
a year ago by aNNiMON
Turn a list of dates into a timeline
Tracker+
3 years ago by GreaterThan (original by pyrochlore)
A plugin for Obsidian that tracks and visualizes in your notes. A continuation of the plugin originally developed by @pyrochlore
Visited Countries
7 months ago by Ivan Peshykov
Obsidian plugin to mark and visualize the countries you've visited on an interactive world map.
WaveDrom
5 years ago by Alex Stewart
Waveform Player
a year ago by Zhou Hua
Weather Widget
3 months ago by mr-asa
Weather widget for display in notes, Canvas, and a separate tab.
YourPulse - Your Writing Activity Visualised
a year ago by Jiri Sifalda
YourPulse.cc - Obsidian.md plugin that turns your vault into a reflection of your creativity, and put your writing on steroids 💪