README file from
GithubSankey Diagrams for Obsidian
Create Sankey diagrams in Obsidian.
Usage
To generate a Sankey diagram, create a sankey code block.
Sankey diagrams consist of links and nodes that can be specified using YAML.
Links
Links are created using a source, a target and a value.
links:
- source: A
  target: B
  value: 1
A link value can be set to ? to have it calculated automatically. The plugin will infer the value using conservation of flow: what enters a node must equal what leaves it. A ? value can be resolved as long as it is the only unknown on one side of a node.
links:
  - source: Income
    target: Budget
    value: 3000
  - source: Budget
    target: Rent
    value: 1200
  - source: Budget
    target: Savings
    value: ?   # resolved as 3000 - 1200 = 1800
Chains are supported — resolving one unknown can unlock others. An error is shown in place of the diagram if a value cannot be resolved.
Nodes
Nodes can be explicitly created to add a specific color to a node. If none or not all nodes are added to the code block, the rest of the nodes will be inferred from the link targets and sources.
nodes:
- name: A
  color: blue
Examples
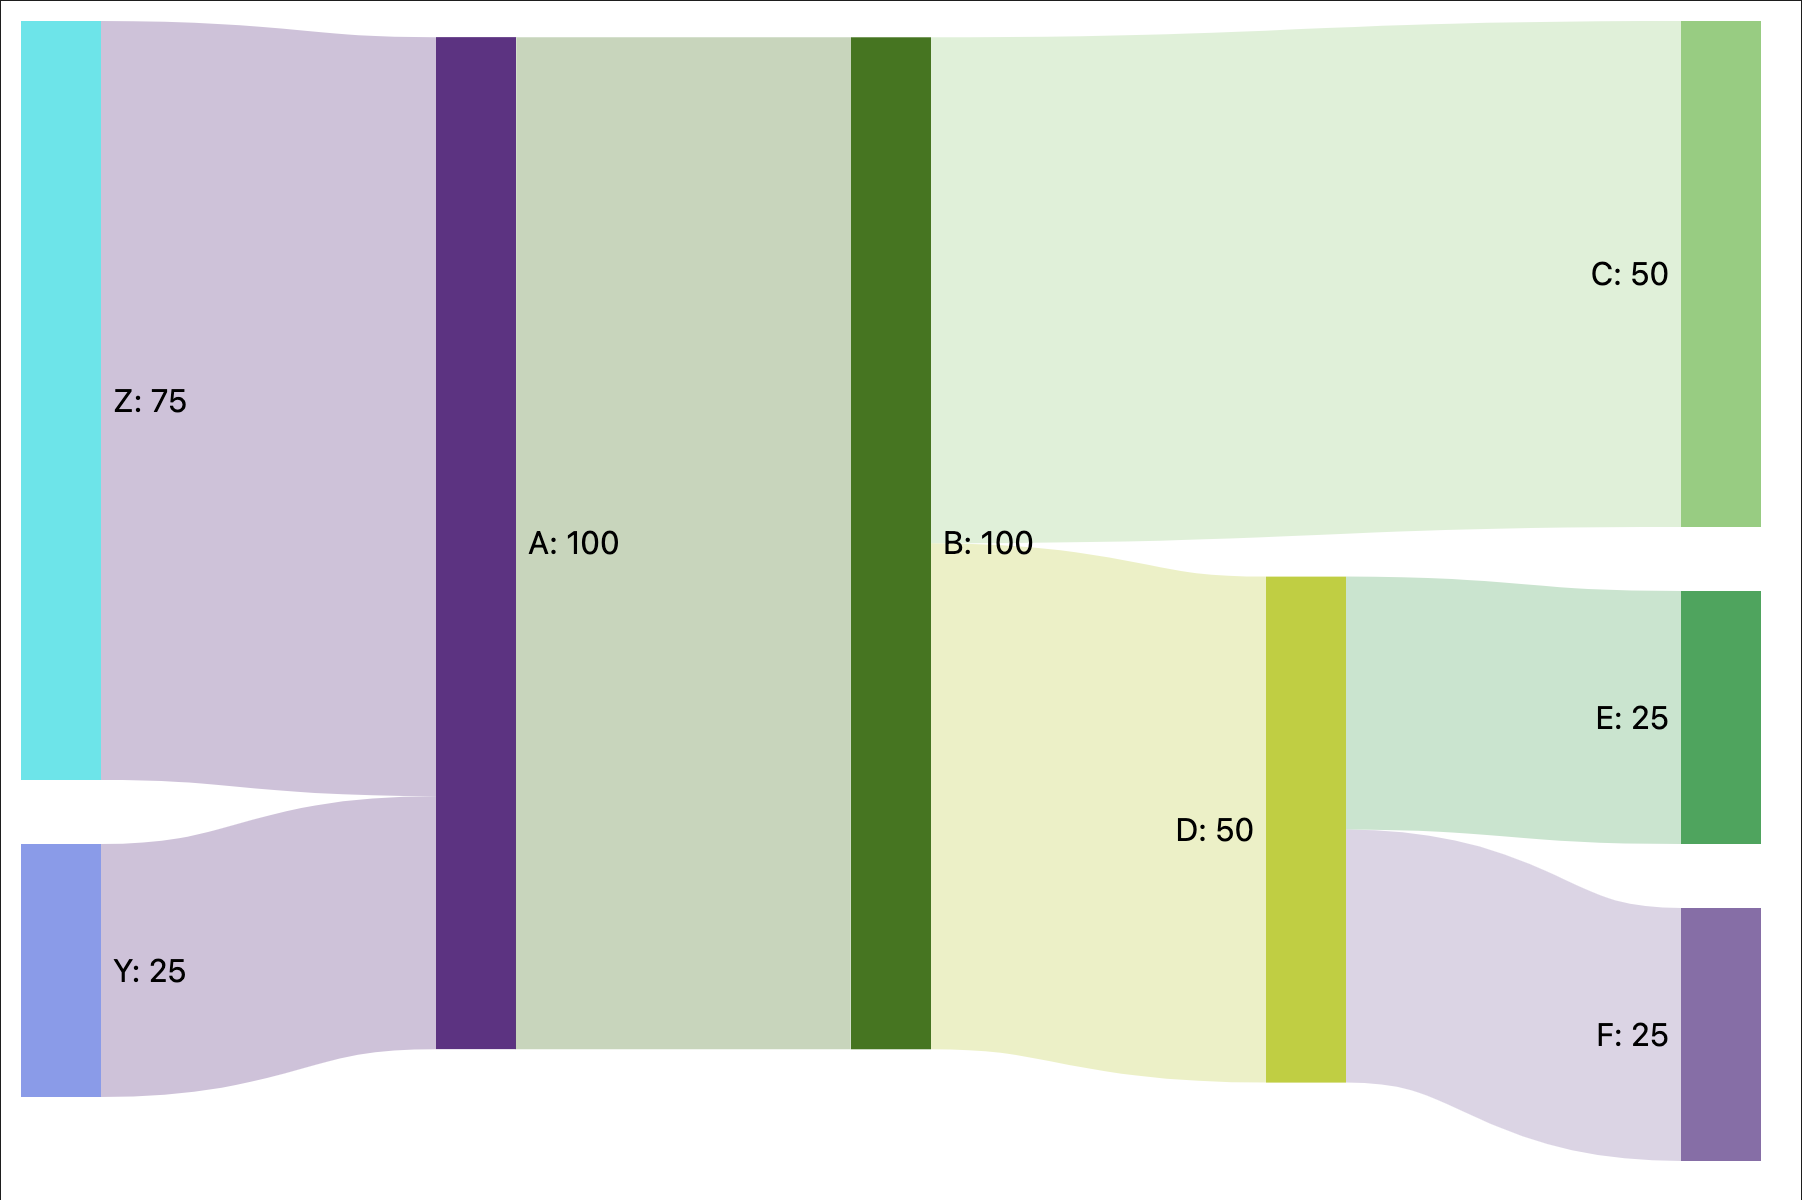
Basic example
A simple example using only links.
links:
- source: A
  target: B
  value: 100
- source: B
  target: C
  value: 50
- source: B
  target: D
  value: 50
- source: D
  target: E
  value: 25
- source: D
  target: F
  value: 25
- source: Z
  target: A
  value: 75
- source: Y
  target: A
  value: 25
Results in:
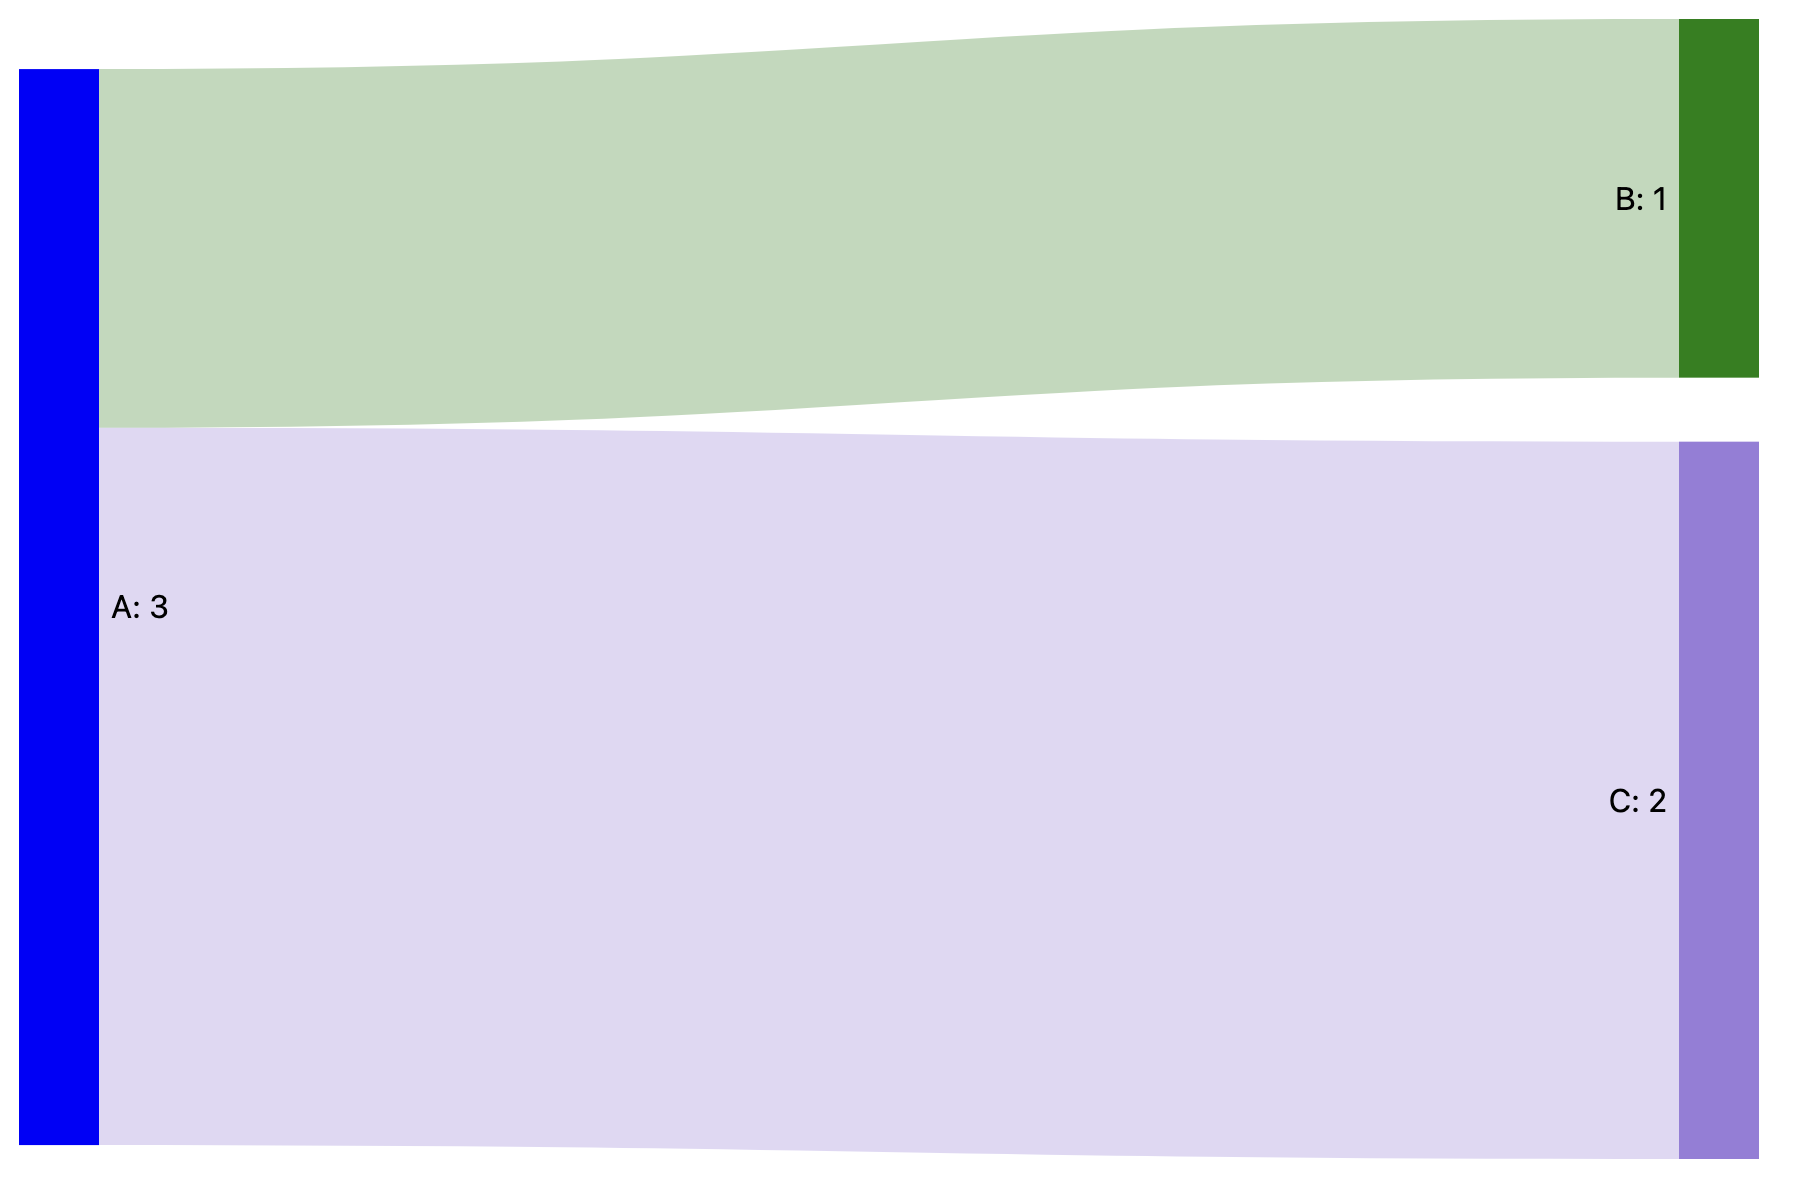
Node colors
An example specifying the colors for nodes A and B.
nodes:
- name: A
  color: blue
- name: B
  color: green
links:
- source: A
  target: B
  value: 1
- source: A
  target: C
  value: 2
Results in: