README file from
GithubPower Tables
Spreadsheet powers for the tables in your notes: cell colors, live formulas that recalculate as you type, sorting, filtering, and Excel's own keyboard shortcuts. Your tables stay plain Markdown, so notes keep working everywhere, with or without this plugin.
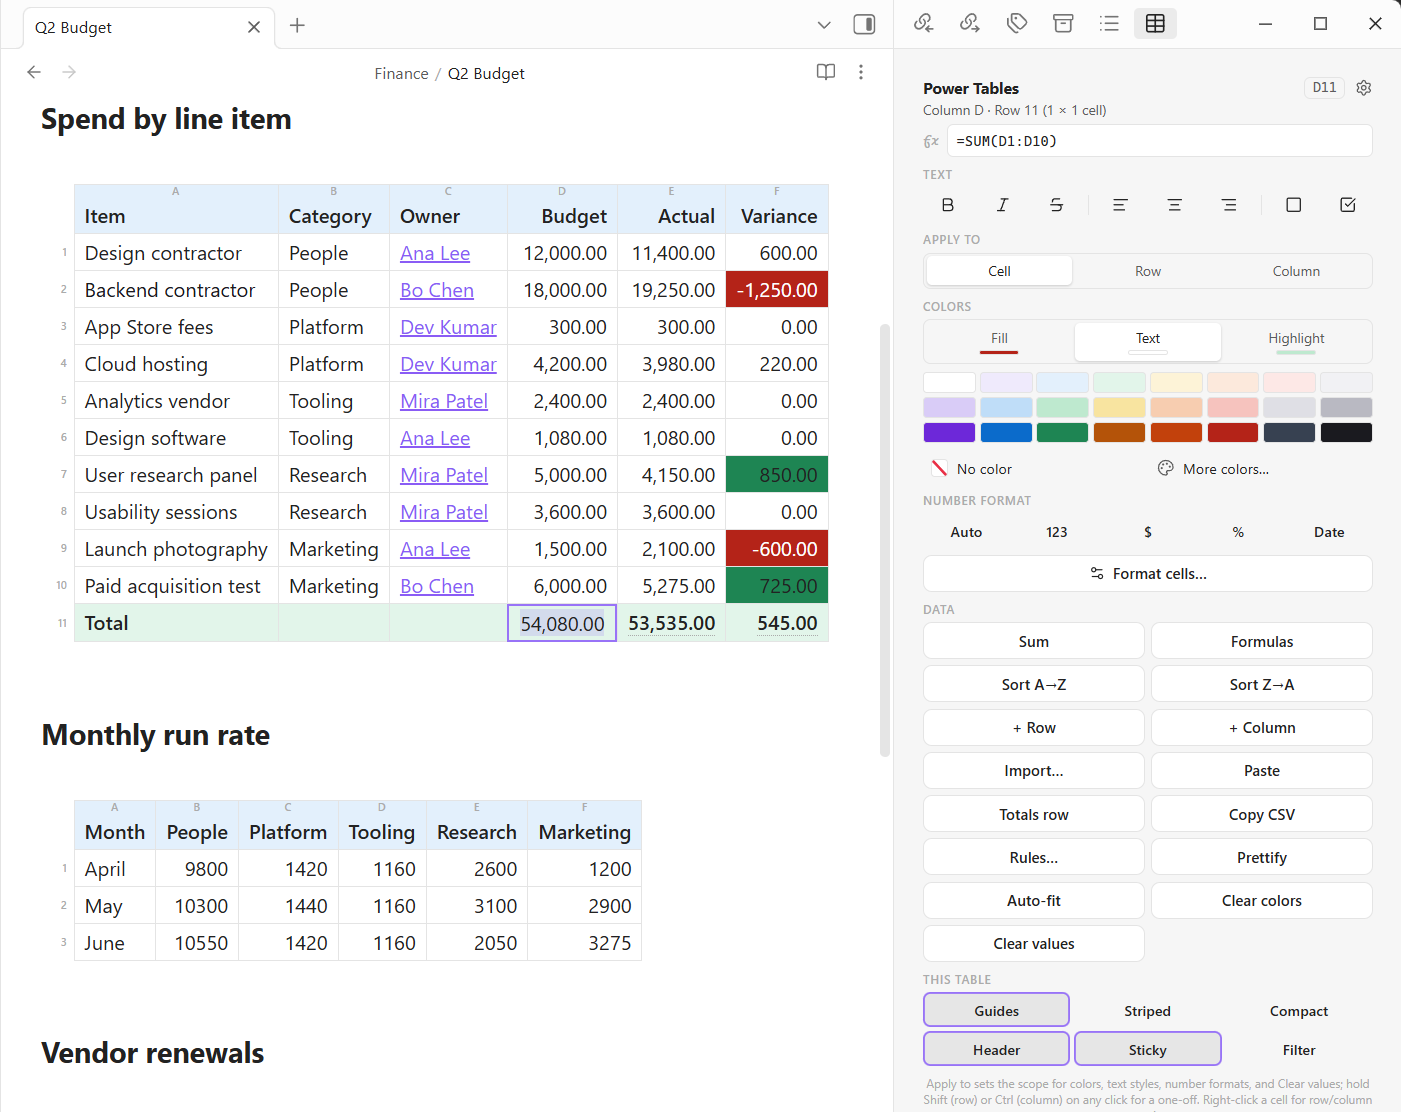
New here? Run the command Insert demo table to see most of this working in ten seconds.
What you get
- Colors: cell fills, text colors, and highlights, from an Office-style palette. Plus conditional rules, color scales, data bars, and icon sets.
- Formulas: 49 Excel functions including
XLOOKUP,SUMIFS,INDEX/MATCH, andIFS, with a formula bar that completes function names and takes references by clicking cells. - Live totals that recalculate whenever the note changes.
- The fill handle: drag the corner of a selection to fill dates, numbers, times, weekdays, and formulas, with a label showing what will land.
- Copy, cut, and paste blocks of cells with Ctrl+C/X/V, formulas and formatting included, plus paste special.
- Excel's selection keys: Shift+arrows to extend, Ctrl+arrows to the edge of the data, Ctrl+Space for the column.
- Sorting that understands numbers, currency, and dates, plus row and column moves.
- AutoFilter: a funnel on every column header, stored in the note so a filtered view is still there tomorrow.
- Number formats: currency, percent, dates, times, and accounting negatives, which can be made sticky on a whole column.
- Data validation: give a column its list of values and every cell gets a picker.
- Sparklines:
=SPARKLINE(B2:G2)draws a row as block characters, stored as text so it survives anywhere the note goes. - Cleanup tools: remove duplicate rows, text to columns, transpose, find and replace, and a Summarize that groups and totals into a new table.
- Import and export from Excel and CSV.
How it stores everything
The plugin never converts your table to HTML. It wraps the content of a cell in one inline span, which Obsidian renders natively:
| Bed Size | Price Per Piece |
| -------- | --------------- |
| Queen    | <span class="ptb" style="background:#0F0">$19.60</span> |
While you are editing, that wrapper is invisible, so the cell shows just its value, still painted. If you ever uninstall the plugin, your notes still open fine everywhere: colors degrade to a simple text highlight and everything else is plain text.
Widths, color rules, filters, and value lists are stored the same way, on the column's header cell, so they travel with the file and survive sorting and column moves.
Using it
Open the Power Tables sidebar from the ribbon, or right-click any cell for the same tools without crossing the screen. The right-click menu follows Excel's shape: cut, copy, and paste at the top, then flyouts for paste special, insert, delete, fill, filter, sort, format, and table tools.
Target a cell by putting your cursor in it, or clicking it in Reading view. Drag-select several and everything applies to all of them, with a selection bar showing Sum, Avg, and Count plus a one-click AutoSum when the cells are numbers.
Apply to switches whether colors and formats hit the cell, the row, or the whole column. Hold Shift or Ctrl for a one-off.
Selecting like a spreadsheet
Column letters and row numbers sit around every table, and they are the selection handles: press a letter for the column, a number for the row, or the corner box for the whole table.
From the keyboard, the keys are Excel's: Shift+arrows extend, Ctrl+arrows jump to the edge of the data, Ctrl+Space takes the column, Shift+Space the row, and Ctrl+A the table.
These keys still belong to the text first. A table cell is a text editor, and Shift+Right selecting the next letter matters more than selecting the next cell. So the sideways keys stay with the text until the caret runs out of it, then start taking cells. Up and down never had a text meaning to take away, so those always take cells.
The fill handle
Drag the small square at the corner of a selection, and a label follows your pointer showing the value that will land there.
- Dates walk a day at a time, or a month at a time when your selection steps months. The style you wrote is the style written back.
- Numbers: two or more set their own step, a lone one copies. Currency symbols, separators, and percent signs all survive.
- Weekdays and month names walk and wrap. Text with a number in it increments the number.
- Formulas are never extrapolated. They copy with their references shifted, so
=C2-B2dragged down becomes=C3-B3, and$B$1stays put.
Drag up or left and the series runs backwards. The whole drag is one undo, however many cells it covered.
Formulas
Type =SUM(B2:B4) into a cell, or use the formula bar. The computed value is stored in the Markdown so notes render everywhere, the formula rides along in the wrapper, and everything recalculates when the cells it reads change.
References are Excel-literal: column letters and 1-based rows counting the header, so C2 is column C's first data row, matching the numbers in the gutter.
| Math and stats | SUM AVG MIN MAX MEDIAN PRODUCT SUMPRODUCT STDEV POWER SQRT INT MOD ABS ROUND ROUNDUP ROUNDDOWN |
| Counting | COUNT COUNTA COUNTBLANK |
| Conditional | IF IFS SWITCH IFERROR AND OR NOT SUMIF COUNTIF AVERAGEIF |
| Multi-criteria | SUMIFS COUNTIFS AVERAGEIFS |
| Text | LEN LEFT RIGHT MID TRIM UPPER LOWER CONCAT |
| Lookup | XLOOKUP VLOOKUP MATCH INDEX |
| Dates | YEAR MONTH DAY |
| Other | SPARKLINE, SUBTOTAL (which skips rows a filter is hiding) |
Operators are Excel's, with Excel's precedence, and everything is evaluated by a built-in parser, never eval. TODAY() and NOW() are deliberately absent: computed values are stored in the note, so a clock-dependent formula would rewrite your notes every time the date rolled over.
Fill down and fill right apply a formula across a range, with $ anchoring what should not travel, exactly as in Excel.
References survive editing. Insert a row and =SUM(D2:D3) becomes =SUM(D2:D4). Sort or move rows and every formula travels with its data instead of reading whatever landed in that slot. Delete something a formula actually named and you get #REF!, which tells you what to go fix rather than a plausible wrong number.
When a formula fails it says which kind of wrong it is, using Excel's error values, because each points somewhere different: #VALUE! at an argument, #NAME? at what you typed, #REF! at something deleted, #N/A at a lookup that found nothing, #DIV/0! at impossible arithmetic. There is one Excel does not have, #CIRC!, for a cell referring to itself, because a silent 0 is the failure this plugin is least willing to ship.
Conditional colors, bars, and icons
Rules color cells in a column by condition: greater than, less than, equals, contains, between, empty, or a pattern. Classic use is negatives in red. Apply once paints the matches now; Add rule stores it and re-applies as values change. Colors you set by hand always win over rules.
Data bars draw a bar behind every numeric cell, as long as the value is against the column's largest. The baseline is zero whenever the column holds no negatives, which is nearly always. That is what a bar is read as: half the length means half the value. Excel's automatic rule instead stretches the smallest to a stub and the largest to full width, which makes 99 and 100 look like nothing and everything.
Icon sets mark each cell by which third of the column's range it sits in, with arrows, traffic lights, or symbols. The bands are thirds of the range rather than measured from zero, because an icon is a rank rather than a quantity.
Bars and icons are drawn rather than written into your note, so they re-scale as values change and as a filter hides rows.
AutoFilter
Turn it on and every column header grows Excel's funnel. Click it for Sort A→Z, filter by value (with a count behind each and a search box), or conditions like contains, between, and is empty.
A funnel in the accent color means that column is filtering, which is the only sign on screen that rows are missing. Columns combine with AND.
Filtering hides rows and never rewrites one. The only thing written is the filter itself, so a filtered view survives closing the note and travels to your other devices. Take the plugin away and every row is simply visible again.
Everything acts on the rows you can see, the way Excel acts on a filtered range. For totals, SUBTOTAL is the one that skips hidden rows, and Insert totals row writes it for you when the table is already filtering.
More tools
- Format painter: the brush copies one cell's look onto others. Click once to paint the next cell, twice to keep painting. Copying a cell with no formatting lets you strip formatting off others.
- Borders work like Excel's menu, including a pen you can draw and erase edges with.
- Checkboxes: cells starting with
[ ]render as real checkboxes you can tick, and the Markdown stays a plain[x] Buy milk. - Column widths: drag a header's edge, or use Auto-fit to size every column to its widest entry. Phones ignore stored widths so text can wrap.
- Summarize groups by one column and totals another into a new plain Markdown table, which everything else works on immediately.
- Cleanup: remove duplicate rows, text to columns, transpose, and find and replace within one table. Formulas follow all of it.
- Import and export: paste rows from Excel or CSV, or copy the whole table out as clean CSV.
Every one of these is also a command, so anything you use often can take a hotkey.
On mobile
Everything renders and edits on phones and tablets, and notes colored on desktop look identical there. The panel lives in the right drawer, and a long press on any cell opens the same menu as a desktop right-click. Add the commands you use most to Obsidian's own toolbar for one-tap access.
Settings
Auto-open the sidebar, cell reference guides, hide cell markup while editing, striped rows, compact tables, header fill (with a separate dark-mode color), sticky headers, AutoFilter, and your own color palette. The panel's This table buttons override any of the appearance settings for one table only.
Limitations
- Tables nested inside callouts or list items: color them from the editing view, since Reading-view click targeting may not resolve those cells.
- Colors are absolute, like Word and Excel, so pick shades that work with both your light and dark themes.
What the catalog's scan reports
The community catalog scans a plugin for what it is capable of, which is not the same as what it does with it. Power Tables reports one thing.
| What the scan reports | What it is | Where |
|---|---|---|
| Clipboard access | Writing: the CSV from Copy table as CSV, the tab-separated text from Copy cells and Cut cells, and a diagnostic report from the troubleshooting command. Reading: Paste cells and Paste rows, which take spreadsheet rows off the clipboard into the table you targeted. Every one is something you just clicked or pressed Ctrl+C/X/V for, and the handlers stand down unless a table selection is live, handing the event straight back to Obsidian otherwise. Nothing reads the clipboard on its own, on a timer, or in the background. | src/main.ts copyCells, pasteCells, pasteFromClipboard, copyTableCsv |
Power Tables makes no network requests of any kind, starts no processes, reads no files outside your vault, and never asks Obsidian for a list of your files. There is no eval, no Function constructor, no innerHTML, and no code fetched and run at runtime.
More Power Plugins
Each one works on its own, and they fit together when you have more than one.
- Power Assistant: record and summarize meetings, capture anything from a link, and ask your notes questions.
- Power Bases: board, calendar, timeline, chart, and gallery views for Bases.
- Power Connect: sync your vault through your own Dropbox, OneDrive, or Google Drive.
- Power Desk: your calendars and your mail, inside your vault.
- Power Editor: a formatting toolbar, drag-and-drop blocks, and WYSIWYG editing.
- Power Explorer: arrange files by hand, and search a huge vault instantly.
- Power Extract: reads the text inside images so you can search it.
Build from source
npm install
npm run build   # typecheck + bundle main.js
npm test        # unit tests for the table-rewrite logic
The installed plugin is just manifest.json, main.js, and styles.css, about 31 KB in total.
Support
Power Tables is built and maintained by one person. If it earns a place in your daily vault, you can buy me a coffee. Nothing in the plugin is held back either way.