Bases Charts

by Moritz Jung
5
4
3
2
1
Score: 40/100

Description

The Bases Charts plugin adds scatter, line and bar chart views to Bases. After choosing a Base, you can map number, date or string values to the X axis and numeric properties to the Y axis, then switch between chart types without leaving the view system. It also supports grouping, color based splits and multi chart modes that separate results by group or by property. The README stays narrow and practical, focusing on axis rules, supported field types and how chart panels are arranged. That makes it a small but direct layer for turning structured notes into visual comparisons inside a Base.

Reviews

No reviews yet.

Stats

stars
22,911
downloads
0
forks
91
days
NaN
days
NaN
days
0
total PRs
0
open PRs
0
closed PRs
0
merged PRs
0
total issues
0
open issues
0
closed issues
0
commits

Latest Version

Invalid date

Changelog

README file from

Github

Bases Charts

This plugin for Obsidian adds three new bases views: Scatter Charts, Line Charts, and Bar Charts.

Usage

First you need a Base, then from there you can (with the plugin installed and enabled) create three new bases views: Scatter Charts, Line Charts, and Bar Charts. Next you need to select the property or formula used for the X axis, in the view settings. On the X axis, Number, Date, and String are supported. Then you can select which properties to display on the Y Axis using the Base's Properties menu (top right). It is recommended that you disable the default activated file name. On the Y axis the plugin only supports values of type Number.

Grouping and Multiple Charts

The plugin supports grouping data points by color and spliting them into multiple charts.

The view settings (in the Base's view menu, top left) include a Multi chart mode dropdown. The avaiable options are Separate by group and Separate by property.

Separating by group will use a Group by sort (Base's Sort menu, top right) to arrange the notes into multiple charts. Here, every group gets it's own chart. Within one chart, data points are colored by their Y axis property.

Separating by property will display a separate chart for each selected Y axis property. Within a chart, data points are colored using a Group by sort (Base's Sort menu, top right).

Scatter Charts
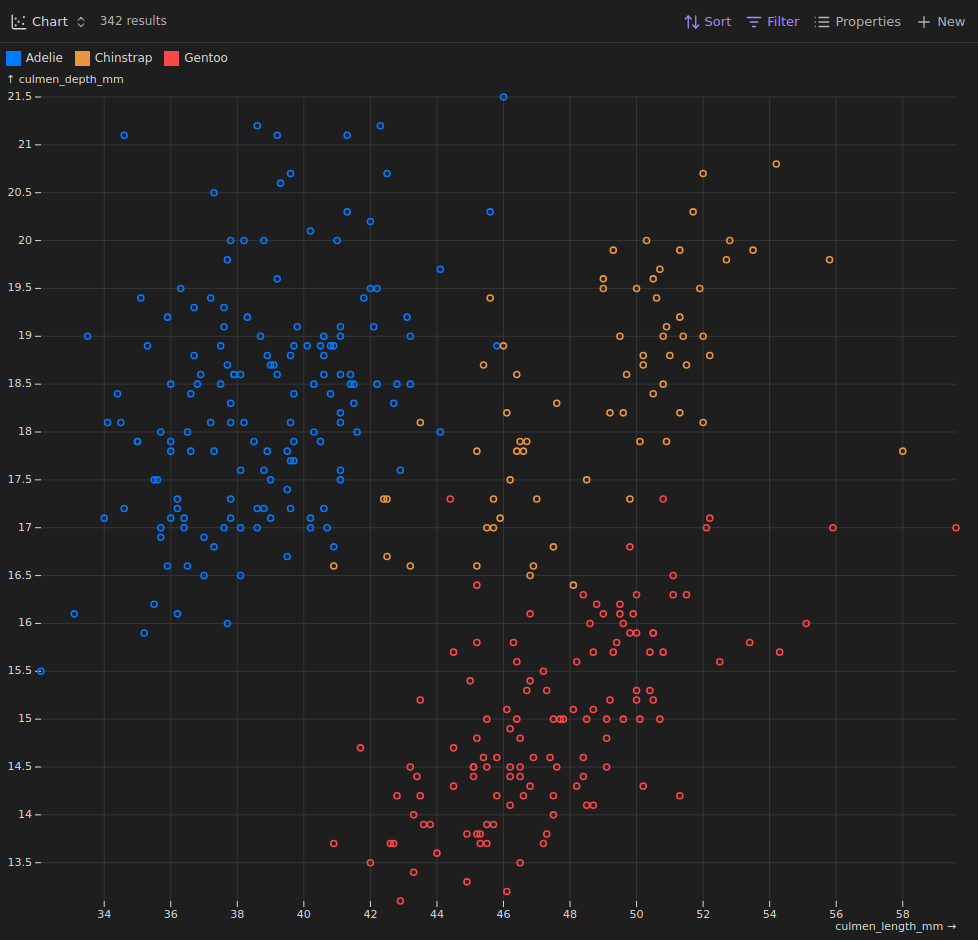
scatter_chart_example

Line Charts

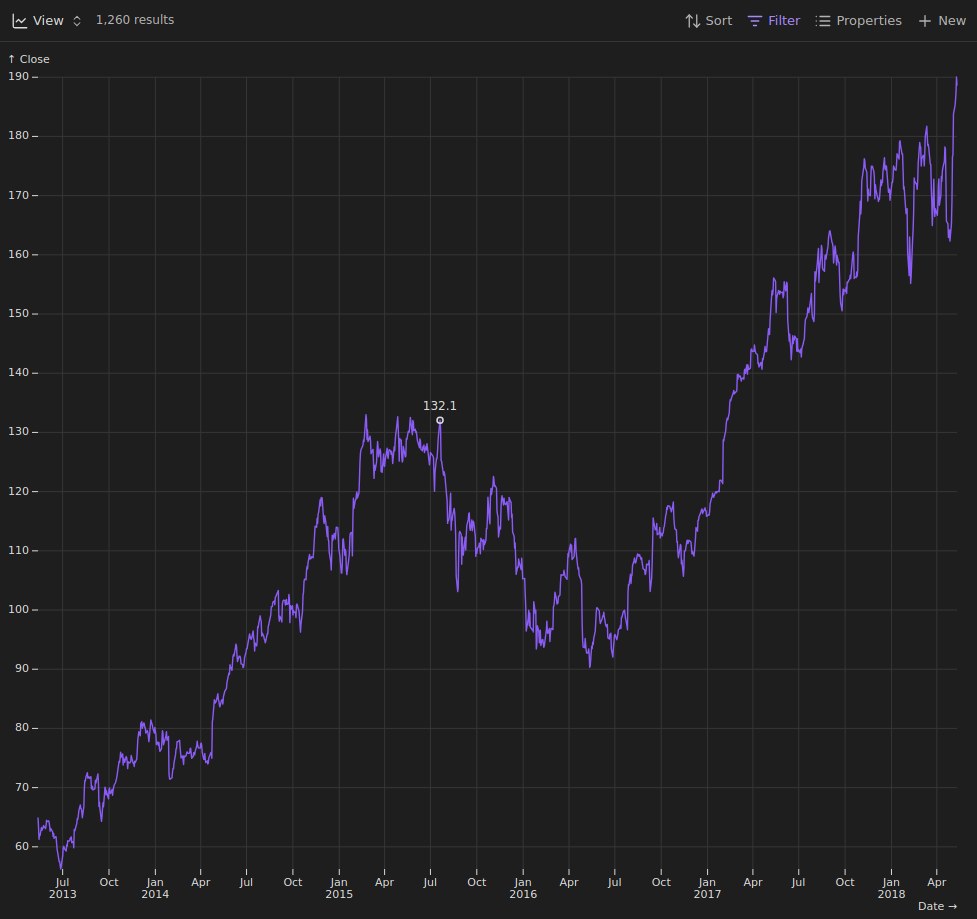
line_chart_example

Bar Charts

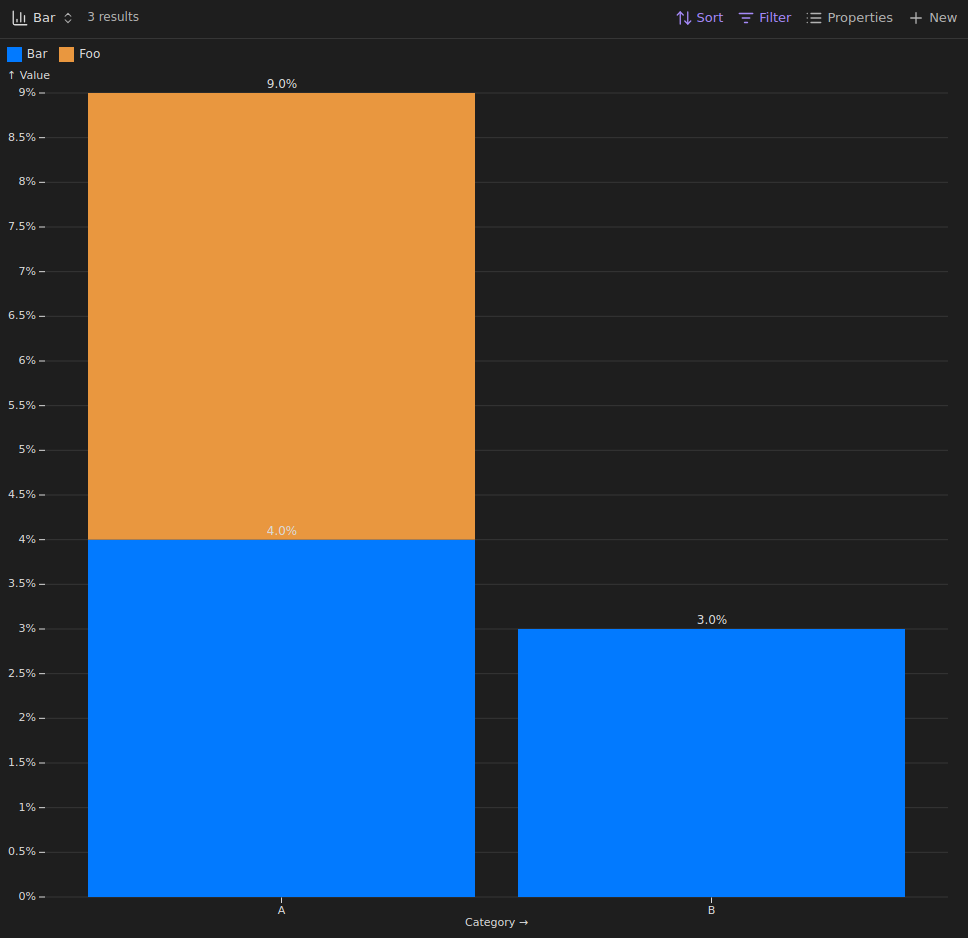
bar_chart_example

Installation

Currently only via BRAT.

License

GPL-3.0

Contributions

Thank you for wanting to contribute to this project.

Contributions are always welcome. If you have an idea, feel free to open a feature request under the issue tab or even create a pull request.

Similar Plugins

info
• Similar plugins are suggested based on the common tags between the plugins.
Charts
6 years ago by phibr0
Charts - Obsidian Plugin | Create editable, interactive and animated Charts in Obsidian via Chart.js
Calendar Bases
5 months ago by Edrick Leong
Adds a calendar layout to bases so you can display notes with dates in an interactive calendar view.
Charts View
5 years ago by caronchen
Data visualization solution in Obsidian, support plots and graphs.
Maps
10 months ago by Obsidian
Map layout for Obsidian Bases. Display your notes as an interactive map view.
Feed Bases
3 months ago by edrickleong
This plugin has not been manually reviewed by Obsidian staff. Adds a feed layout to bases so you can display notes with their content in an editable feed view.
Kanban Bases View
5 months ago by I. Welch Canavan
A kanban-style drag-and-drop custom view for Bases.
Base Board
2 months ago by mderazon
This plugin has not been manually reviewed by Obsidian staff. Organize notes into Kanban boards using frontmatter properties. Drag and drop cards between columns powered by Bases.
Notion Bases
a month ago by bgarciamoura
Turn any folder into a database — table, kanban board, gallery, calendar, timeline and list views powered by frontmatter. - This plugin has not been manually reviewed by Obsidian staff.
Plotly
5 years ago by Dmitriy Shulha
Obsidian plugin to embed Plotly charts into markdown notes.
Financial Doc
3 years ago by Studio Webux
Financial Documentation and Tracking using CSV format and Chart.js directly in Obsidian
Bases Paginator
22 days ago by sean2077
Adds a paginated table view with quick filtering to Bases. Features include pagination controls, global search, click-to-filter, and filter presets. - This plugin has not been manually reviewed by Obsidian staff.
Vega Visualizations
4 years ago by Justin Kim
Create Vega and Vega-Lite visualizations in https://obsidian.md/.
Size History
3 years ago by Piotr Borowski
Graph with vault size over time
SQLite DB
a year ago by Stefano Frigerio
SQLSeal Charts
a year ago by hypersphere
Charting extension for SQLSeal Obsidian Plugin. Visualise your data!
Daily Note Metrics
a year ago by Andre-Diamond
Obsidian Plugin that parses Daily Notes and uses data to create charts
TinyChart
2 years ago by Alin Coop
Dead simple ASCII charts for Obsidian.
Canvas Bases
4 days ago by callumalpass
Canvas-style layouts and JSON Canvas materialization for Obsidian Bases. - This plugin has not been manually reviewed by Obsidian staff.
Workout Planner
7 months ago by Rares Spatariu
TaskNotes
2 months ago by callumalpass
Note-based task management with calendar, pomodoro and time-tracking integration.
Sheet Plus
21 days ago by ljcoder
Create Excel-like spreadsheets and easily embed them in Markdown.
Habitify
16 days ago by justrelaxdc
A tracker for habits and metrics. Features heatmaps, charts, and streaks while keeping your data in pure Markdown files. No hidden databases. - This plugin has not been manually reviewed by Obsidian staff.
Power Bases
8 days ago by Power Plugins
Add board, calendar, timeline, chart, gallery, and table views to Bases, with inline editing, colors, rollups, field types, formulas, and CSV import. - This plugin has not been manually reviewed by Obsidian staff.