README file from
GithubQuackBlocks
Executable SQL code blocks for Obsidian, powered by DuckDB WASM. Query local Parquet files and render results as inline tables or charts.
Features
- DuckDB WASM — run analytical SQL directly inside Obsidian, no external server
- Parquet datasources — load tables from frontmatter-declared
.parquetfiles - Inline tables — query results render as formatted HTML tables
- Inline charts — visualize with Observable Plot (bar, line, area, dot, heatmap, box, waffle, and more)
- Per-block options — configure charts with a compact directive syntax
- PDF export compatible — charts use explicit SVG dimensions for reliable export
Preview
Export your notes to PDF and the charts come with you. Every visualization is rendered as SVG with explicit dimensions, so they survive Obsidian's PDF export perfectly.
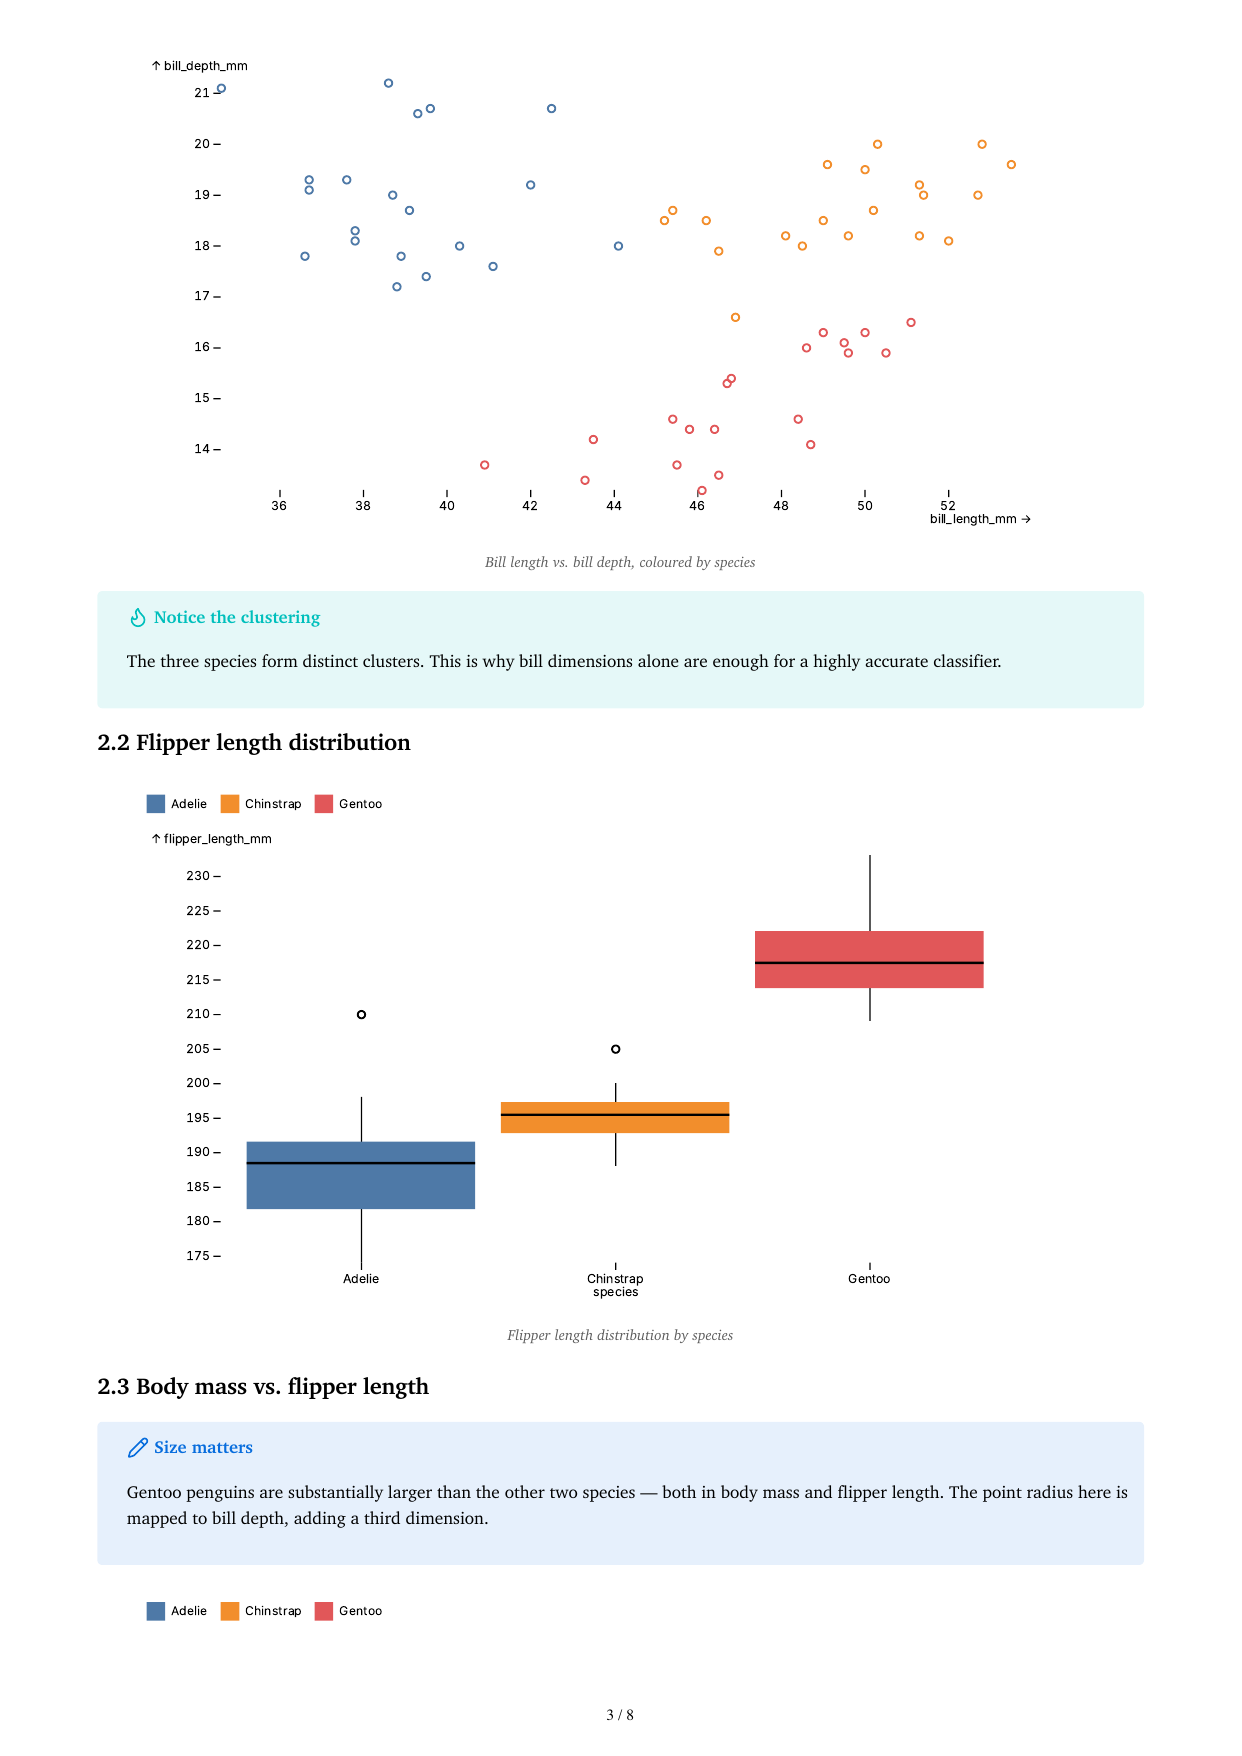
The screenshot above shows a Palmer Penguins report exported to PDF — tables, bar charts, scatter plots, box plots, and faceted charts all intact.
Installation
Manual install
- Download
main.js,manifest.json, andstyles.cssfrom the latest release - Copy them into your vault's
.obsidian/plugins/quackblocks/folder - Enable QuackBlocks in Obsidian's Community Plugins settings
BRAT
Add yllucsyeoj/quackblocks to the BRAT plugin list.
Usage
1. Declare datasources in frontmatter
---
datasources:
  sales: ./data/sales.parquet
  customers: ./data/customers.parquet
plotDefaults:
  color:
    legend: true
---
Paths are resolved relative to the note's directory. Absolute paths and ~ home directory expansion are also supported:
---
datasources:
  sales: ./data/sales.parquet        # relative to note
  bigdata: ~/datasets/large.parquet  # expands to $HOME/datasets/large.parquet
  external: /mnt/data/file.parquet   # absolute path
---
2. Write quack code blocks
Table output
```quack
SELECT region, SUM(amount) AS revenue
FROM sales
GROUP BY region
ORDER BY revenue DESC
```
Chart output
```quack
chart=bar caption="Revenue by region" { "x": "region", "y": "revenue" }
SELECT region, SUM(amount) AS revenue
FROM sales
GROUP BY region
```
Directive syntax
The first line of a quack block can contain directives:
| Directive | Description |
|---|---|
chart=<type> |
Render as a chart (see supported types below) |
caption="..." |
Add a caption/figure label |
{ ... } |
JSON options passed to Observable Plot |
Example with full options:
```quack
chart=bar caption="Monthly revenue" { "x": "month", "y": "revenue", "color": { "scheme": "blues" } }
SELECT month, revenue FROM sales
```
Supported chart types
| Type | Observable Plot mark |
|---|---|
bar |
Plot.barY |
barX |
Plot.barX |
line |
Plot.lineY |
area |
Plot.areaY |
dot |
Plot.dot |
cell |
Plot.cell |
rect |
Plot.rect |
boxY |
Plot.boxY |
boxX |
Plot.boxX |
waffleY |
Plot.waffleY |
waffleX |
Plot.waffleX |
text |
Plot.text |
Chart configuration
Chart options inside { ... } are passed to Observable Plot. Most options work exactly as documented there. QuackBlocks automatically separates plot-level options (axes, margins, size) from mark-level options (data encodings like x, y, fill).
Plot-level options
| Option | Description |
|---|---|
width / height |
Chart size in pixels |
marginLeft / marginRight / marginTop / marginBottom |
Margin overrides |
title / subtitle / caption |
Chart titles |
grid |
Show grid lines (true or axis name) |
style |
CSS styles object |
facet |
Faceting configuration |
Mark-level options
| Option | Description |
|---|---|
x / y |
Column name or axis config object for the mark |
fx / fy |
Facet column names |
stroke / fill |
Column name for color encoding |
r |
Dot radius column or constant |
tip |
Enable tooltips (true) |
When a dual-purpose key like x or color is a string, it maps to a column (mark-level). When it's an object, it becomes plot-level axis configuration:
chart=bar { "x": "month", "y": "revenue", "color": { "scheme": "blues", "legend": true } }
Color
QuackBlocks injects a 20-color categorical palette by default. You can override it:
chart=dot { "x": "x", "y": "y", "stroke": "category", "color": { "range": ["#e41a1c", "#377eb8"] } }
Or use a continuous scheme:
chart=cell { "x": "x", "y": "y", "fill": "value", "color": { "scheme": "blues" } }
Faceting
Split charts into small multiples with fx or fy:
chart=dot { "x": "bill_length", "y": "bill_depth", "fx": "species", "stroke": "sex" }
Plot defaults
Set global defaults in frontmatter under plotDefaults. These are merged with per-block options (block wins).
---
plotDefaults:
  width: 800
  height: 400
  color:
    legend: true
    scheme: "blues"
---
Settings
| Setting | Description |
|---|---|
| Debug logging | Log DuckDB lifecycle and query details to the developer console |
| Default chart width | Default width in pixels (overridable per block) |
| Default chart height | Default height in pixels (overridable per block) |
Requirements
- Obsidian desktop app (uses Node.js
fsfor Parquet I/O) - Parquet files for datasources
Examples
See the examples/ folder for a complete Palmer Penguins demo note with tables, bar charts, dot plots, box plots, faceted charts, and correlation matrices — designed to look great when exported to PDF.
Claude Code Skill
A companion Claude Code skill is included in skill/. Install it to generate QuackBlocks reports from parquet files with natural language prompts.
# Copy the skill into your Claude skills directory
cp -r skill ~/.claude/skills/quackblocks
Then ask Claude: "Analyze the sales data in ~/datasets/sales.parquet and create a QuackBlocks report with monthly revenue charts."
Development
npm install
npm run build
npm run dev watches main.ts and rebuilds on change.
Inspiration
QuackBlocks is inspired by Evidence.dev — the markdown-based BI framework that proved SQL and documents belong together. Evidence showed that analysts shouldn't have to choose between a notebook and a dashboard; QuackBlocks brings that same philosophy into Obsidian, letting you query Parquet files and render charts inline while you write.
License
MIT