README file from
GithubNeighbourhood Graph
An Obsidian plugin that shows the current note's neighbourhood as an interactive force-directed graph in a sidebar panel. Navigate your vault by exploring connections between notes, shared tags, and backlinks.
What it does
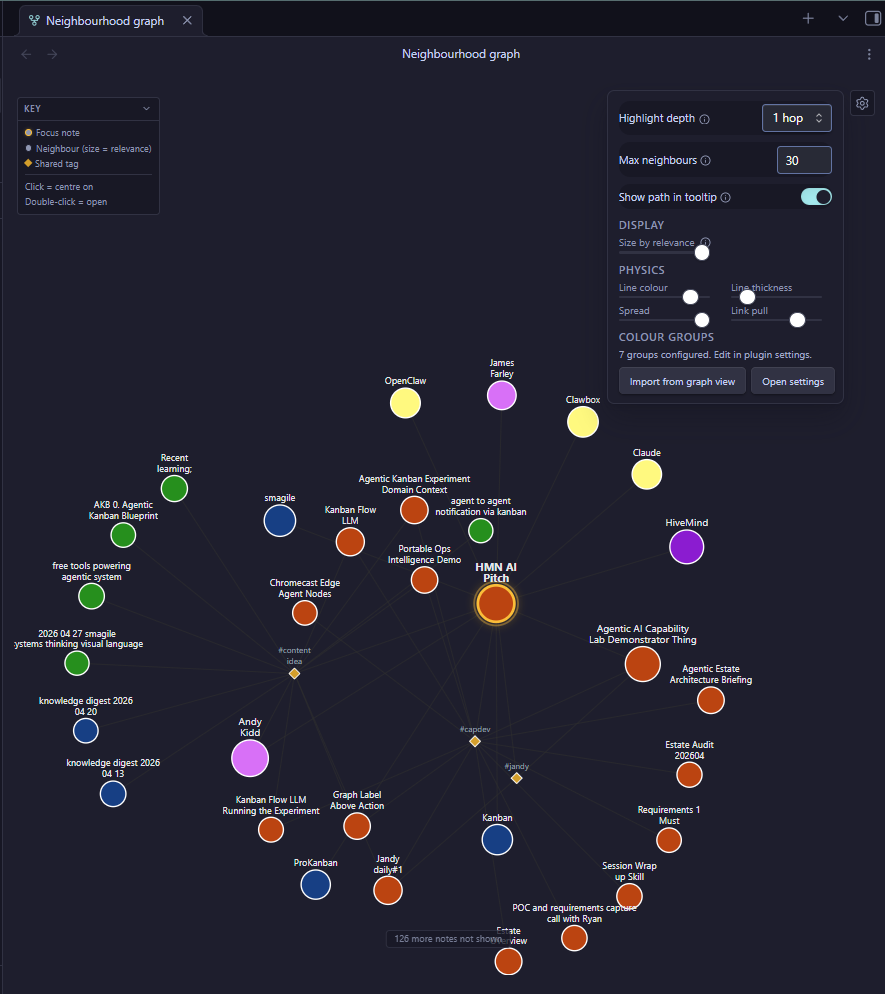
Opens as a right-sidebar panel. As you navigate between notes, the graph recentres on the active note and shows:
- The focus note highlighted with an amber glow, largest node
- Neighbour notes connected via shared tags or backlinks, sized by relevance
- Shared tag nodes (diamond shapes) representing tags that connect notes
- Edges showing the relationships between notes and concepts
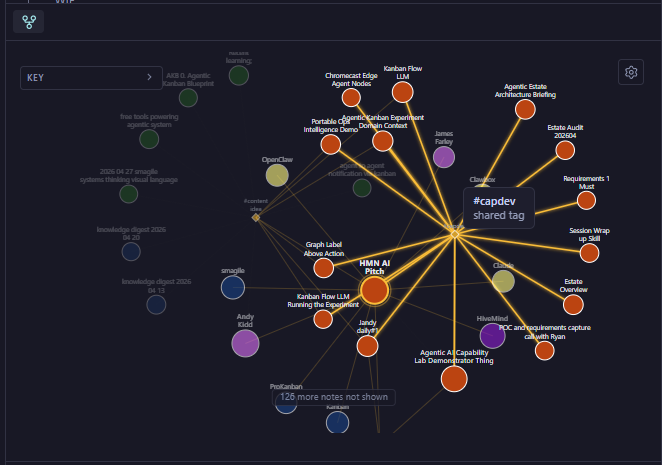
Hover any node to highlight its connections. At depth 2, secondary connections also light up, revealing the structure around any note in the neighbourhood.
Interactions
| Action | Behaviour |
|---|---|
| Hover | Highlights direct connections (and secondary connections at depth 2) |
| Click | Recentres the graph on that note |
| Double-click | Opens the note in the editor and recentres |
| Drag | Repositions a node |
| Scroll | Zoom in and out |
Installation
From the community plugin directory
- Settings > Community plugins > Browse
- Search "Neighbourhood Graph"
- Install and enable
Manual install
- Download
main.js,manifest.json, andstyles.cssfrom the latest release - Create a folder at
<your vault>/.obsidian/plugins/neighbourhood-graph/ - Copy all three files into that folder
- Settings > Community plugins > reload and enable Neighbourhood Graph
Settings
Click the gear icon in the top-right corner of the graph panel. Each setting has an info icon with a tooltip explaining what it controls.
| Setting | Description | Default |
|---|---|---|
| Highlight depth | Tiers of connections highlighted on hover. 1 = direct only. 2 = direct + secondary. | 2 hops |
| Max neighbours | Cap on displayed notes. Most strongly connected shown first. | 30 |
| Show path in tooltip | Display the vault folder path when hovering a note. | On |
| Size by relevance | How much node size varies by connection strength. 0 = uniform, 10 = dramatic. | 5 |
Physics controls
Four sliders for fine-tuning the graph layout: line colour, line thickness, spread (repulsion), and link pull (clustering).
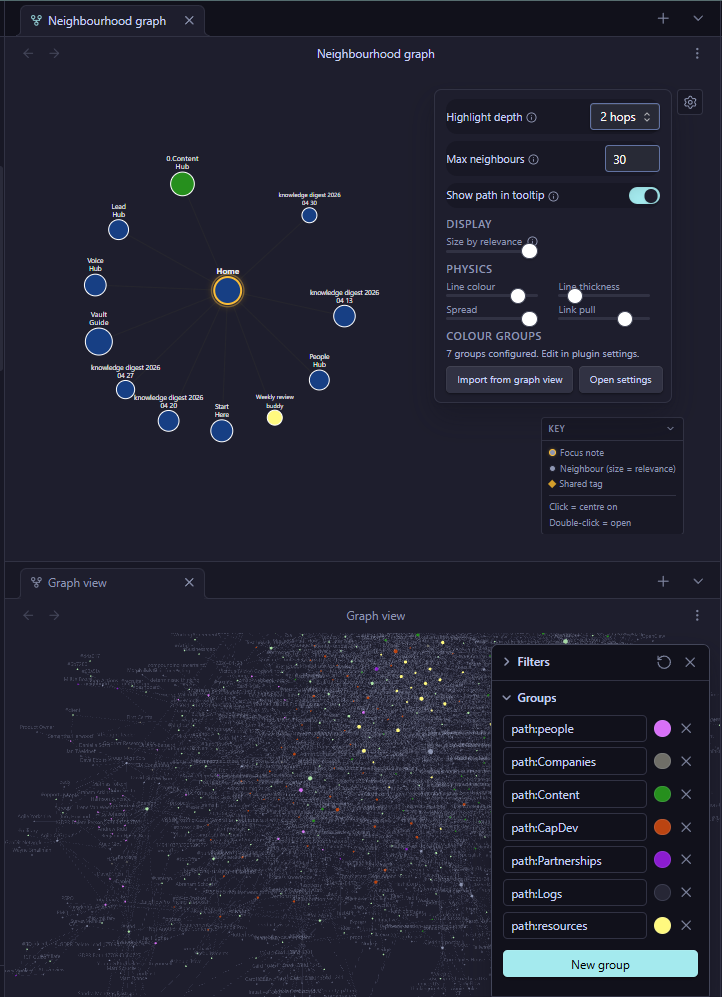
Colour groups
Colour groups are configured in Settings > Neighbourhood Graph. Assign colours to notes by query:
path:people/matches notes in the people foldertag:#projectmatches notes with the project tag- Plain text matches against note titles
First matching rule wins. You can import colour groups directly from Obsidian's built-in graph view with the Import from graph view button.
How it works
The plugin reads Obsidian's metadata cache for tags and resolved links. No custom frontmatter required. Neighbours are scored by connection strength:
- Shared tags between the focus note and a neighbour
- Direct wikilinks (outbound and inbound)
- Bidirectional links score higher
- Well-connected hub notes rank higher (logarithmic scaling)
The top N neighbours (configurable) are shown, with node size reflecting their relevance to the focus note.
Licence
MIT