README file from
GithubObsidian JessieCode
Plugin of Obsidian that creates interactive graphs described by JessieCode.
What is JessieCode?
JessieCode is a script language for JSXGraph, for describing interactive graphs.
A = point(1, 0);
B = point(-1, 0);
C = point(0.2, 1.5);
L_AB = line(A, B);
L_AC = line(A, C);
K_ABC = circle(A, B, C);
How to use
To create a graph create a code block with the language set to jessiecode. You can also use YAML frontmatter to set the width and height of the graph, or other attributes defined in the JSXGraph documentation.
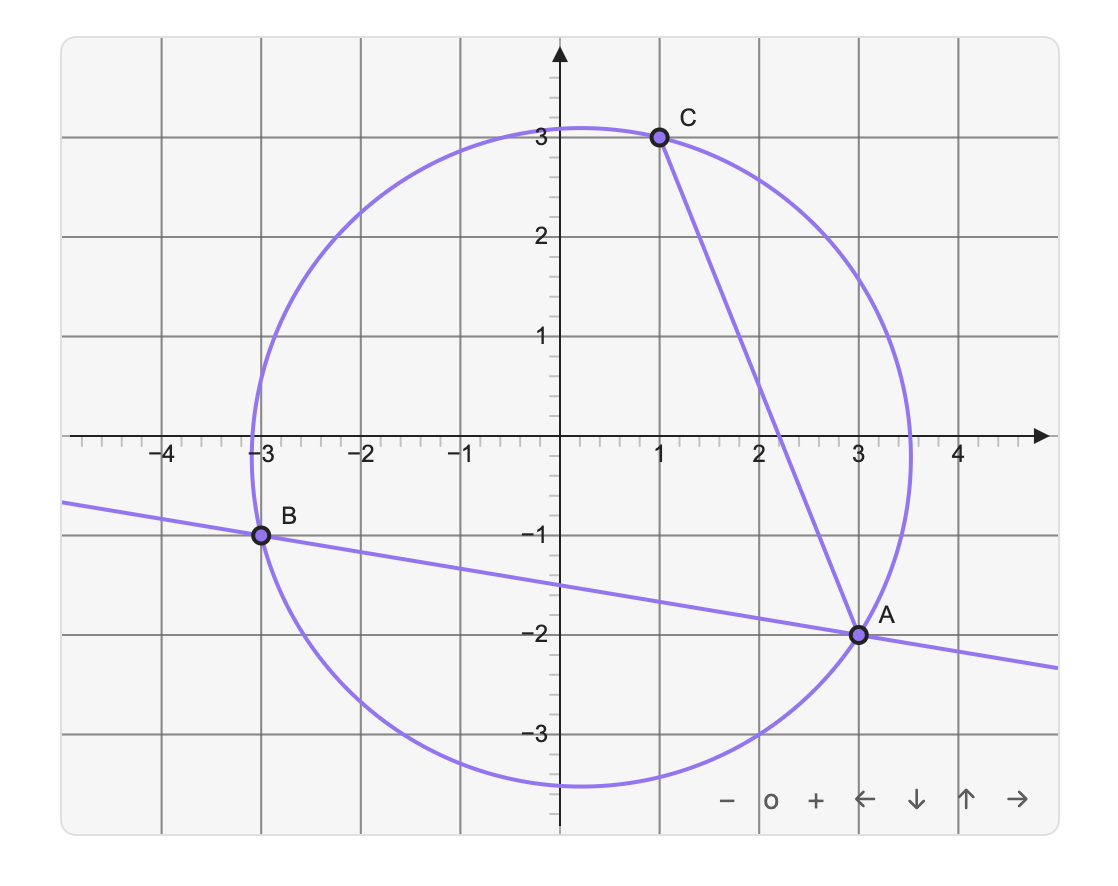
```jessiecode
---
width: 500
height: 400
boundingBox: [-5, 4, 5, -4]
---
A = point(3, -2);
B = point(-3, -1);
C = point(1, 3);
line(A, B);
segment(A, C);
circle(A, B, C);
```
And it will be rendered as:
Bugs
If you find any bugs with this plugin please create a new issue so that they can be resolved.
Contributing
If you want to contribute please create an issue or pull request.
Attribution
This plugin uses
And also thanks to obsidian-graphs plugin for the inspiration.