README file from
GithubInteractive Hill Chart
An Obsidian plugin for tracking work progress on a hill chart. Dots are draggable, linked to notes, and live entirely inside your vault — no external services, no hidden state.
What is a Hill Chart?
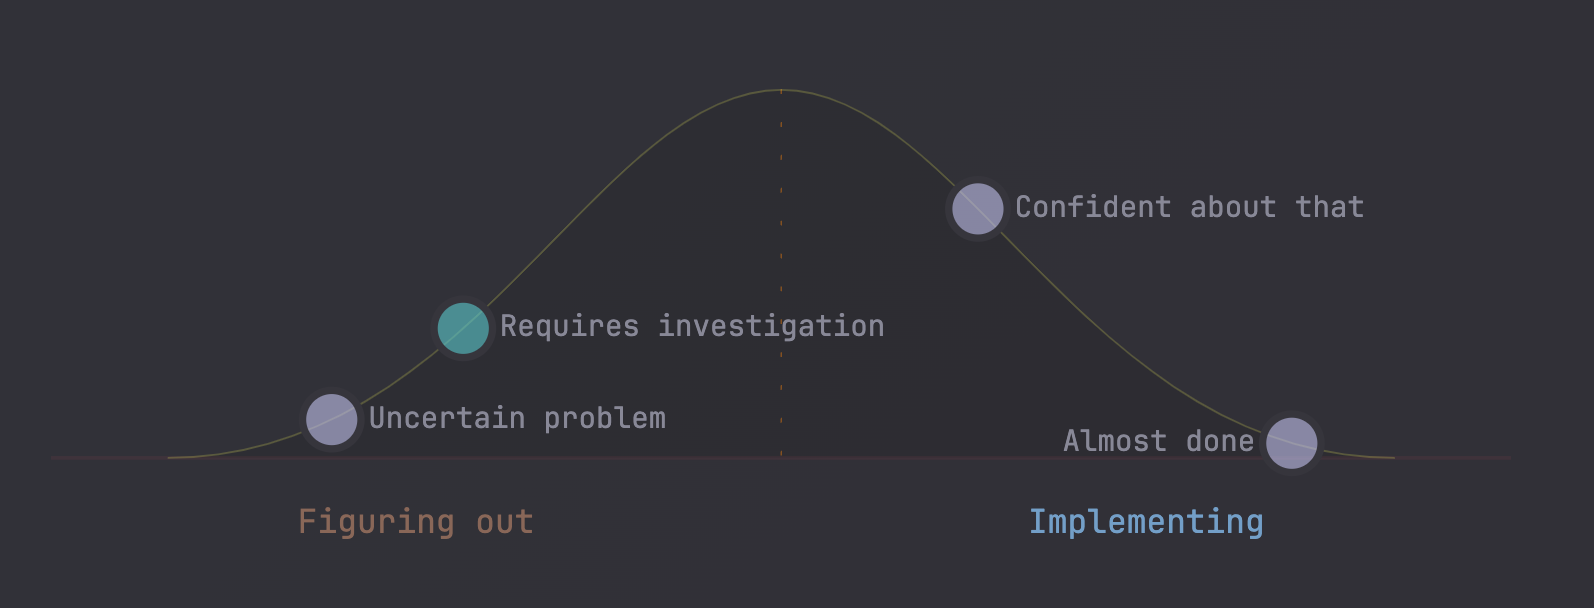
A hill chart visualizes progress as a hill: the left (uphill) side represents work that is still being figured out, and the right (downhill) side represents work that is being executed. Moving a dot over the peak signals a shift from uncertainty to confidence.
Quick Start
Create a fenced code block with the hill-chart language tag:
```hill-chart
dots:
  - 10: Research
  - 40: Design
  - 70: Build
  - 90: Ship
```
Each entry is - <position>: <label>, where position is 0–100. Drag a dot to update its position — changes are written back to the code block automatically. Use Obsidian wiki-link syntax as a label ("[[Note Name]]") to make it clickable.
CSS Variables and Theming
All colors default to currentColor (Obsidian's text color), so charts work in light and dark themes out of the box. Every color field accepts any of these formats:
color: currentColor          # inherits Obsidian text color (default)
color: var(--text-muted)     # any Obsidian CSS token
color: var(--color-accent)
color: "#23ad32"             # hex — 3, 4, 6, or 8 digits
color: "#fff"
color: "#ffffff80"           # hex with alpha
color: rgb(35, 173, 50)
color: rgba(35, 173, 50, 0.5)
color: hsl(130, 66%, 41%)
color: hsla(130, 66%, 41%, 0.8)
color: red                   # any CSS named color
color: transparent
Full Example
```hill-chart
chart:
  curve:
    stroke: "#23ad32"
    strokeWidth: 2
    fill: none
  baseline:
    visible: true
    stroke: "#23ad32"
    opacity: 0.2
    strokeWidth: 1
  uphill:
    label: "Figuring it out"
    fontSize: 11
    color: var(--text-muted)
  downhill:
    label: "Making it happen"
    fontSize: 11
    color: var(--text-muted)
  divider:
    visible: true
    stroke: var(--text-muted)
    strokeWidth: 1
    style: dashed
  dot:
    color: "#23ad32"
    opacity: 0.85
    radius: 7
    fontSize: 11
    fontColor: var(--text-muted)
dots:
  - 5: "[[Idea]]"
  - position: 30
    label: "[[Research]]"
  - position: 55
    label: "[[Design]]"
    style:
      color: "#f5a623"
      opacity: 0.9
      radius: 9
      fontSize: 13
      fontColor: var(--text-muted)
  - position: 80
    label: "[[Build]]"
  - 95: "[[Ship]]"
```
Acknowledgements
Inspired by obsidian-hill-charts by stufro.
Releasing: see RELEASING.md