README file from
GithubCodeless Heatmap Calendar
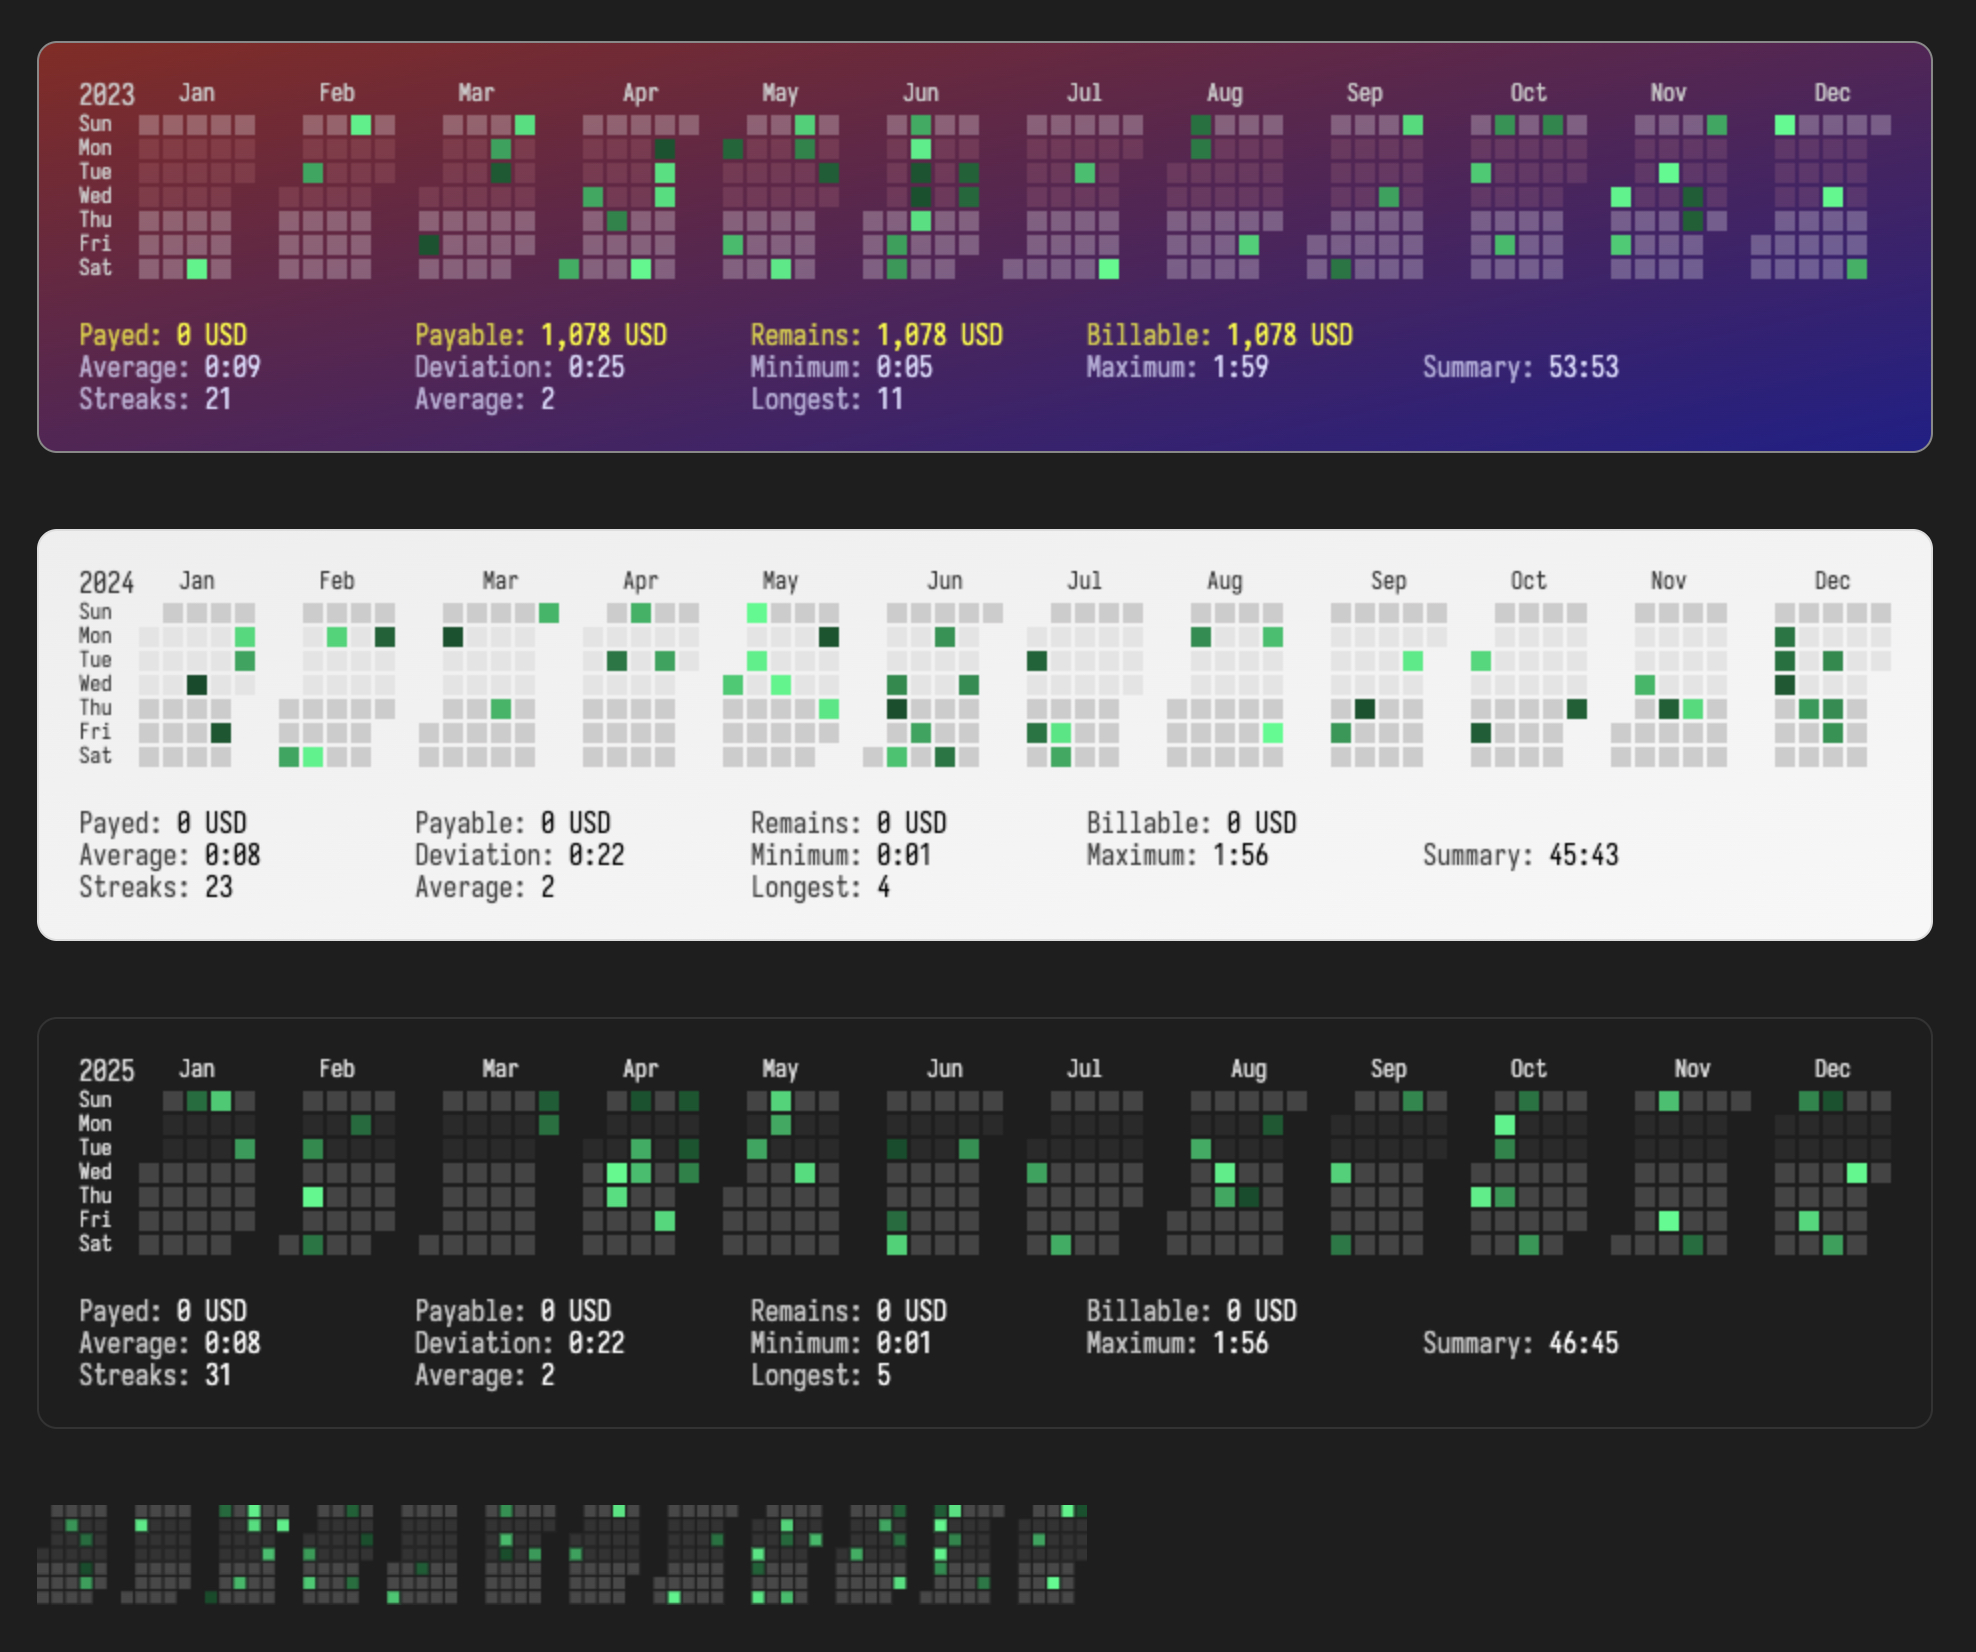
Codeless Heatmap Calendar is a full-featured Obsidian plugin that generates a highly customizable heatmap calendar using data from the Toggl API. Whether you're tracking time, visualizing productivity, or testing with fake data, this plugin offers a seamless and intuitive experience. It’s designed for users who want complete control over their heatmap’s appearance and functionality.
Features
Core Features
- Heatmap Calendar Generation: Visualize your Toggl time tracking data as a heatmap calendar directly in Obsidian.
- Fake Data Testing: Test the plugin without a Toggl API key by using fake data.
- Toggl API Integration: Fetch real-time data from your Toggl account with ease.
- DataviewJS Support: Requires DataviewJS for advanced data handling and visualization.
Customization Options
- Multiple Themes: Choose from predefined themes or create your own to match your Obsidian setup.
- Color Gradients: Customize the heatmap’s intensity colors using named colors, hex codes, or gradients.
- Font and Text Styling: Adjust font styles, sizes, and colors for a personalized look.
- Calendar Layout: Control cell size, padding, border radius, and spacing for a perfect fit in your notes.
- Tooltip Customization: Style tooltips with custom backgrounds and text colors.
Advanced Features
- Billable Hours Tracking: Track paid and remaining billable hours with customizable hourly rates and currencies.
- Statistics Display: View general statistics (total hours, averages), streaks (longest streak, current streak), and billable information directly in the heatmap.
- Off Days Configuration: Define days you don’t expect to log time (e.g., weekends) without affecting streak calculations.
- Project Filtering: Filter data by specific Toggl projects for focused insights.
Independent Settings
- Multiple Instances: Configure multiple heatmap calendars with separate settings for different use cases.
- Granular Control: Each instance can have its own theme, data source, and display preferences.
Installation
- Open Obsidian.
- Go to Settings → Community plugins.
- Click Browse and search for Codeless Heatmap Calendar.
- Install the plugin and enable it.
- Ensure DataviewJS is installed and enabled, as it is required for this plugin to function.
Usage
Step 1: Insert a Heatmap Calendar
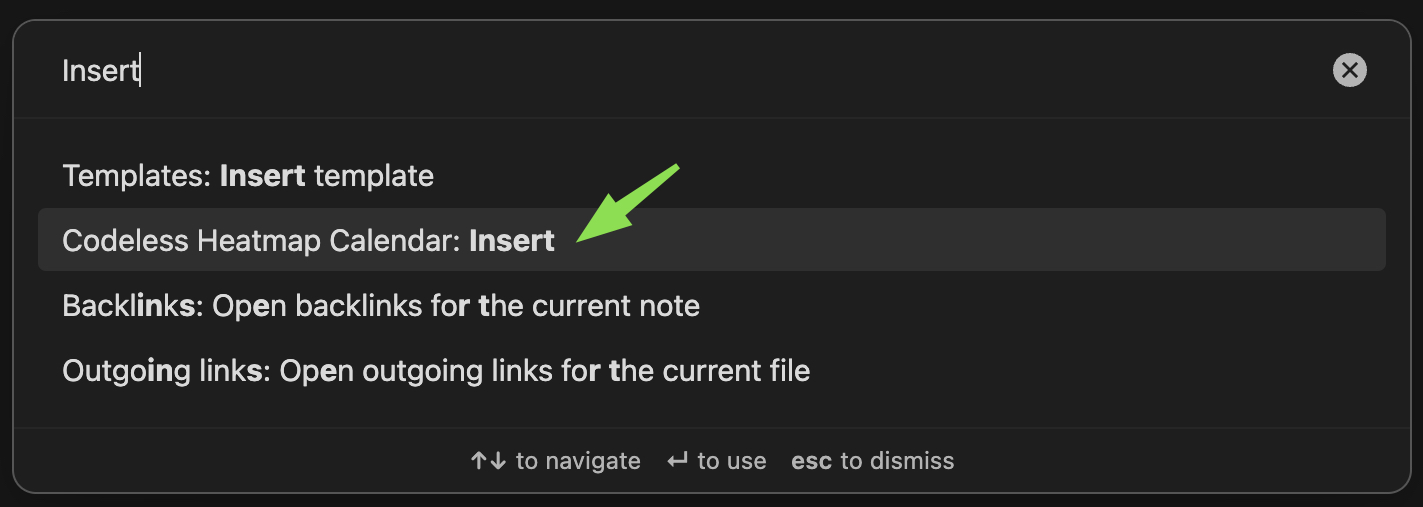
- Open the Command Palette in Obsidian by pressing
Ctrl+P(orCmd+Pon macOS). - Search for and select "Codeless Heatmap Calendar: Insert".
- A new instance of the heatmap calendar will be inserted into your note.
Step 2: Configure the Plugin
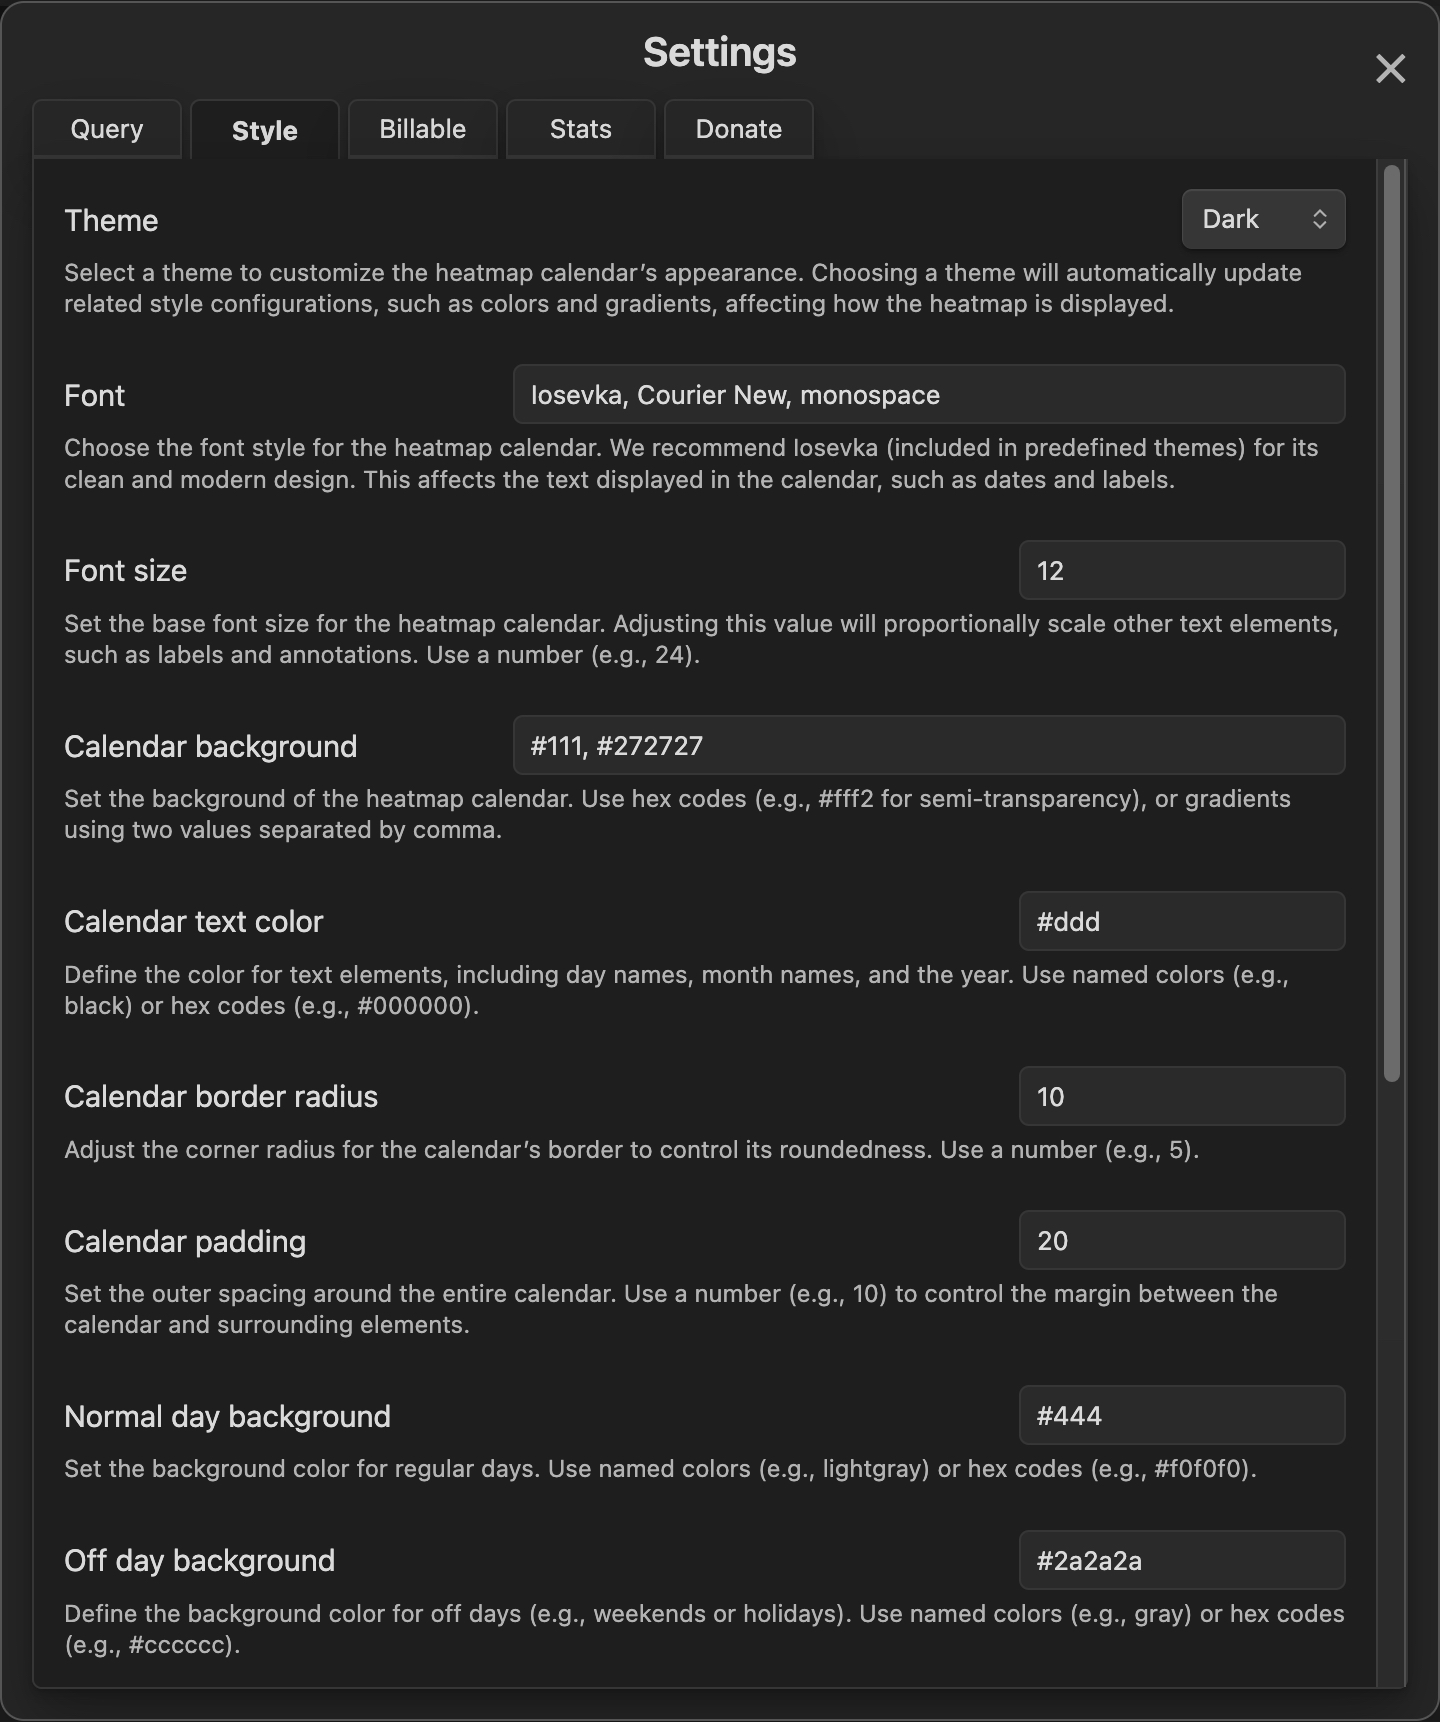
- Open the Settings modal in Obsidian.
- Navigate to the Codeless Heatmap Calendar settings tab.
- Configure the plugin using the Query, Style, Billable, and Stats tabs to tailor the heatmap to your needs.
Why Choose Codeless Heatmap Calendar?
- Full-Featured: From Toggl API integration to fake data testing, this plugin has everything you need.
- Highly Customizable: With independent settings for each instance, you can create heatmaps that fit your workflow perfectly.
- User-Friendly: Detailed hints and tooltips in the settings panel make configuration a breeze.
- DataviewJS Integration: Leverage the power of DataviewJS for advanced data handling and visualization.
Support the Developer
If you find this plugin useful, consider supporting its development:
- One-Time Donation: Donate via Stripe
- Monthly Subscription: Subscribe via Stripe
About the Developer
Codeless Heatmap Calendar is developed by Behnam Aghajani and published by Web Tech Access Ltd. under the MIT License.
- Developer Email: [email protected]
- Publisher GitHub Page: https://github.com/webtechaccess
License
This project is licensed under the MIT License. See the LICENSE file for details.
This version focuses on highlighting features and customization options while keeping the settings details concise. It also emphasizes the plugin’s full-featured nature and DataviewJS requirement. Let me know if you’d like further adjustments! 😊