README file from
GithubChartSpark
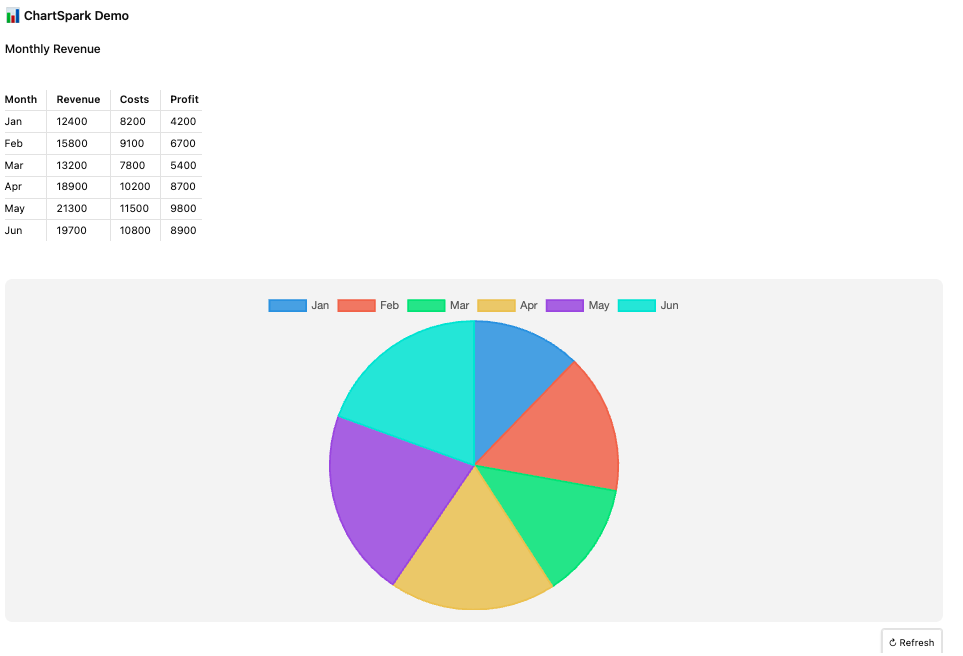
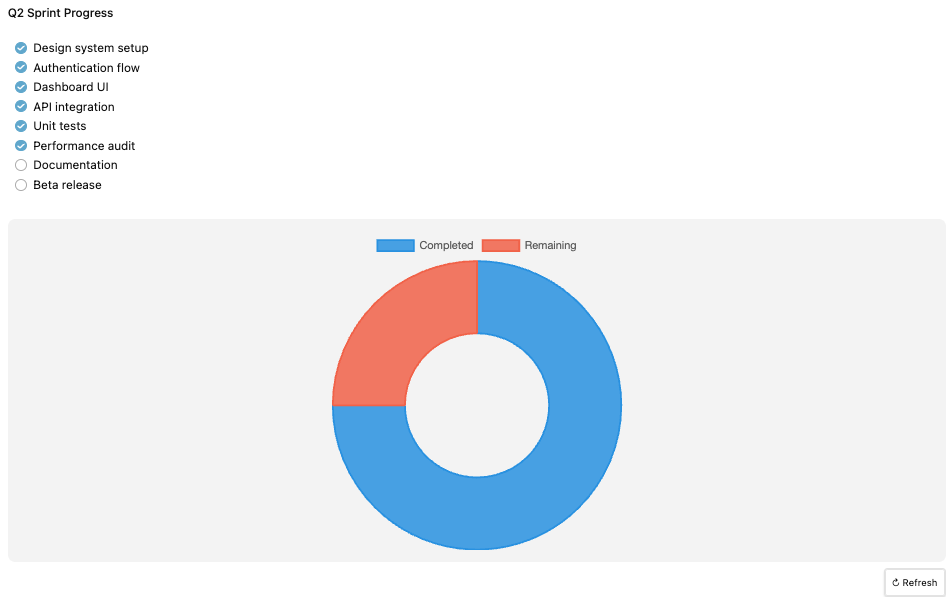
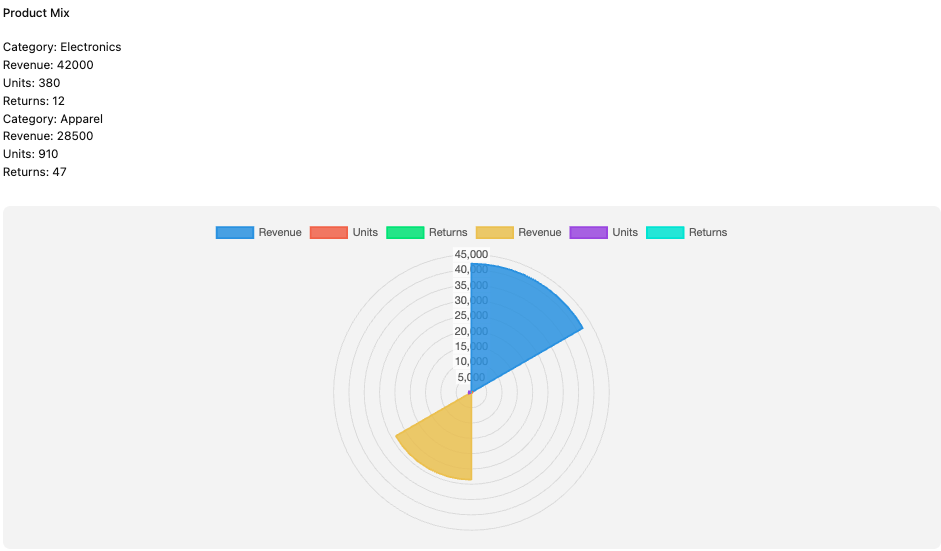
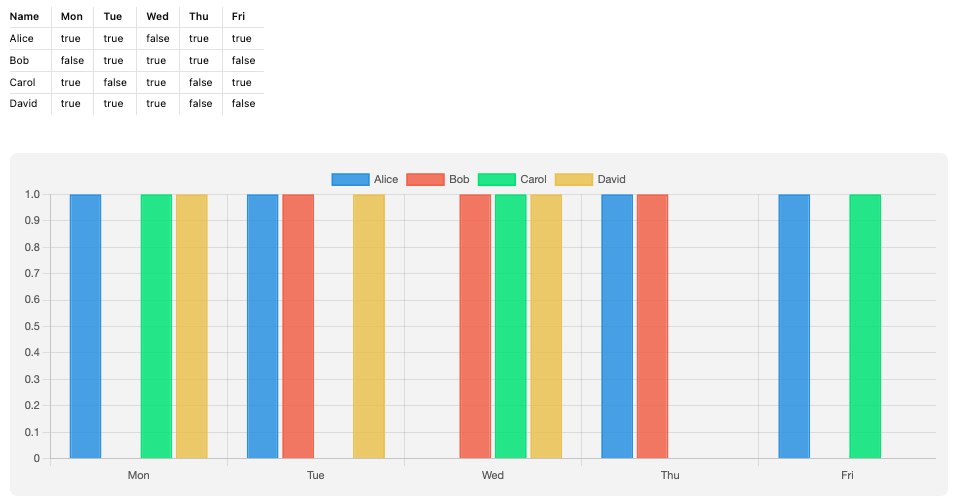
Turn your Obsidian notes into interactive charts in seconds. Place your cursor inside any table, checkbox list, or key:value block — press a shortcut — and a live, auto-refreshing chart is inserted directly into your note.
Screenshots
| Monthly revenue (Pie) | Sprint progress (Doughnut) |
|---|---|
 |
 |
| Product mix (Polar Area) | Team availability (Bar) |
|---|---|
 |
 |
Features
- Six chart types — Bar, Line, Pie, Doughnut, Radar, Polar Area
- Smart table support — column picker lets you choose which column is the category axis and which columns are the value series
- Axis swap — transpose the data matrix with one click (rows ↔ columns)
- Horizontal bar — toggle any bar chart to horizontal orientation
- Multi-block picker — when a note has multiple data blocks, a picker shows previews of each so you select exactly what to chart
- Live auto-refresh — charts update in real time as you edit the source data; each chart tracks its own source block by ID, so multiple charts in the same note refresh independently
- Versatile parsing — handles booleans (
true/false), currency ($1,200), percentages (42%), yes/no, and mixed tables; strips trailing empty columns automatically - Delete button — hover any chart to reveal a × button that removes the block in one click
- Vault scan — aggregate checkbox data across your entire vault or a folder into a single chart
- PNG export — download any chart as an image
- Theme-aware — adapts to Obsidian's light and dark themes via CSS variables
Supported input formats
| Format | Example |
|---|---|
| Markdown table | | Item | Sales | |
| Checkbox list | - [x] Write tests |
| JSON object | {"Revenue": 500, "Cost": 300} |
| JSON array | [{"name": "A", "count": 5}] |
| Key : value | Revenue: 500 |
Tables can contain numbers, booleans (true/false, yes/no), currency, or percentages — any column whose values can be converted to a number is offered as a value series.
Usage
Generating a chart
- Press
Cmd/Ctrl + Shift + C(or right-click anywhere in the editor → Generate chart from this note) - If the note has multiple data blocks, a picker appears — click the one you want
- For tables, choose the label column (category axis) and value columns (series)
- Use ⇄ Swap axes to transpose rows and columns
- Select a chart type from the tabs; use ↔ H-Bar for horizontal bars
- Click Insert chart — a
chartsparkblock is inserted directly below the source data
Auto-refresh
Charts re-render automatically when the source data changes. Each chart stores a unique ID and scans backwards from its own position to find its source block — so editing one table only refreshes the chart that belongs to it.
Manual refresh
Enable Show refresh button in settings to display a ↻ Refresh button on each chart.
Deleting a chart
Hover over any chart and click the × button in the top-left corner.
Manual chart block
Charts are stored as standard fenced code blocks and can be written or edited by hand:
```chartspark
{
  "type": "bar",
  "data": {
    "labels": ["Q1", "Q2", "Q3", "Q4"],
    "datasets": [{"label": "Revenue", "data": [120, 95, 140, 180]}]
  }
}
```
Any valid Chart.js configuration can be placed in the data and options fields.
Commands
| Command | Shortcut | Description |
|---|---|---|
| Quick chart | Cmd/Ctrl + Shift + C |
Generate a chart from data in the active note |
| Generate chart (with preview) | — | Same, but opens the full column-picker preview |
| Scan vault and generate chart | — | Aggregate checkbox data across vault |
| Export active chart as PNG | — | Save the focused chart as an image |
| Insert chart template | — | Insert a blank chart block to edit manually |
Settings
| Setting | Default | Description |
|---|---|---|
| Default chart type | Pie | Chart type pre-selected in the preview modal |
| Auto-refresh charts | On | Re-render when source data changes |
| Max chart width | 600 px | Maximum rendered width (200–1200 px) |
| Show refresh button | On | Display a manual ↻ button on each chart |
Installation
From the Obsidian community plugin list
- Open Settings → Community plugins → Browse
- Search for ChartSpark
- Click Install, then Enable
Manual installation
- Download
main.js,manifest.json, andstyles.cssfrom the latest release - Copy them to
<Vault>/.obsidian/plugins/chartspark/ - Reload Obsidian and enable ChartSpark in Settings → Community plugins
Development
npm install
npm run dev      # watch mode with hot reload
npm run build    # production build
npm test         # run unit test suite