
README file from
GithubTerrain Graph 山峰图谱
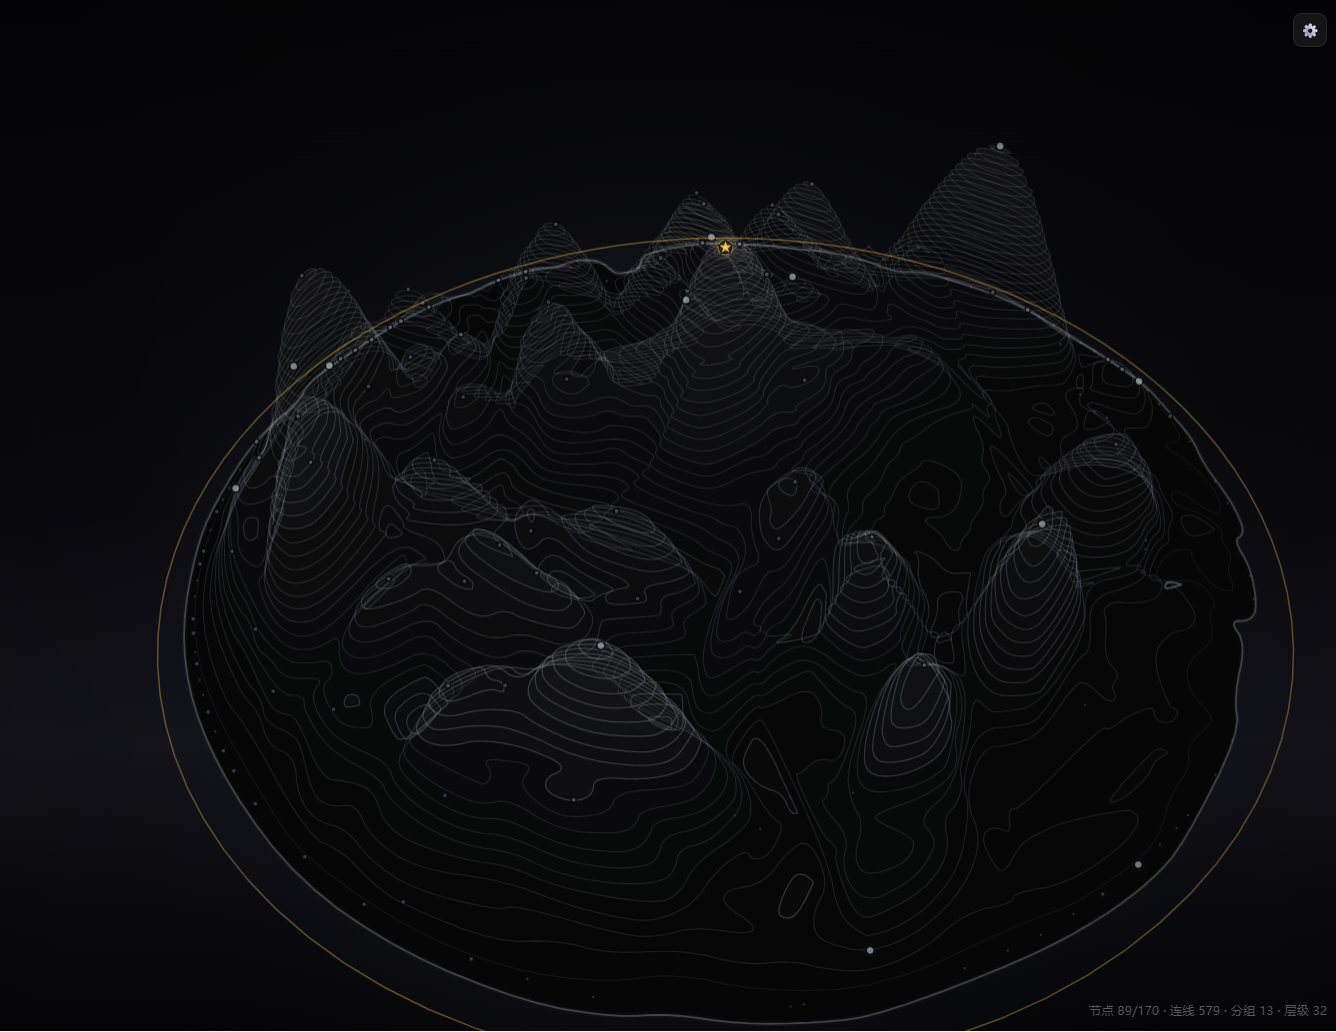
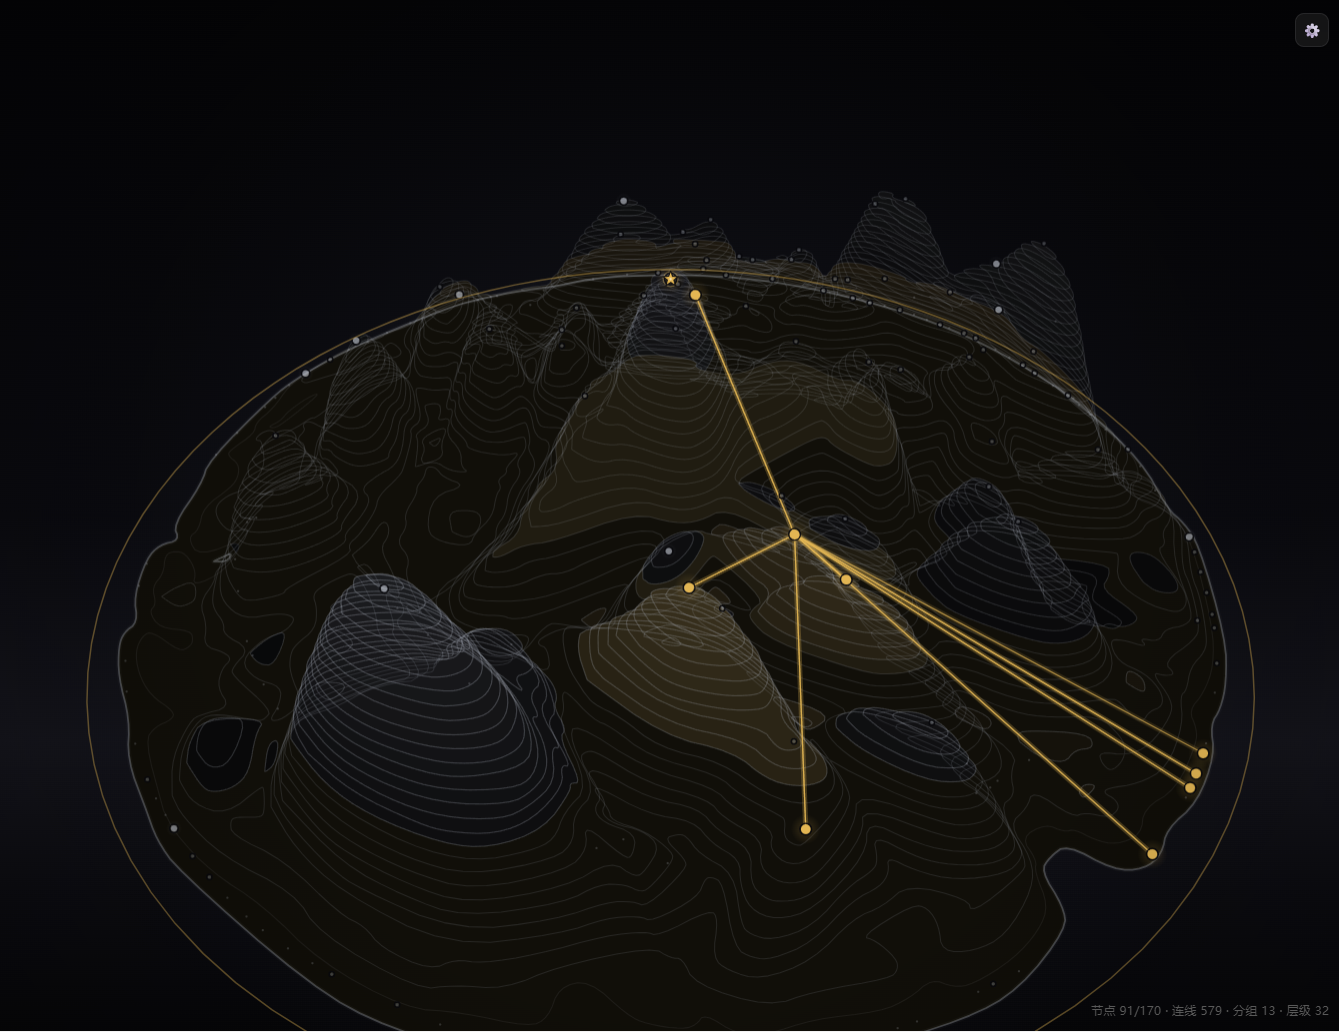
Render your Obsidian link graph as a 3D tilted mountain contour map: the more links a note has, the higher its peak; tightly connected notes cluster into one mountain; the most-linked note is the main peak of the whole range.
Preview
Features
- Altitude = link-count level: link counts are log-normalized and quantized into N levels; equal link counts share the same altitude
- One mountain per community: label-propagation (LPA) community detection groups tightly linked notes into a single mountain, with valleys between ranges
- Layout follows the official graph view: mountain positions come from the same d3-force
simulation the built-in graph uses (forceX/Y, charge, link, collision), with parameters read from
your vault's
graph.json; the layout is stable across opens - Realistic terrain: weighted Gaussian upper-envelope height field + Everest-region DEM shaping + fBm/ridge-noise micro-terrain; contours extracted with Marching Squares, then Douglas-Peucker + Chaikin smoothing
- Filled surfaces with lighting: contour rings are filled, hillshade lighting, painter's algorithm depth sorting so near mountains occlude far ones
- Adaptive circular canvas: radius scales with node/edge count, edged with a thin gold ring
- 3D interactions: drag to rotate, scroll to zoom, double-click to reset, click to open a note, right-click to deselect
- Selection highlight: clicking a node lights up its direct neighbors in gold (optional)
- Main peak marker: the highest-degree note is marked with a star at the center
- Settings panel: official-graph-style, all settings auto-saved
Install
Manual
- Copy
manifest.json,main.js,styles.cssfromplugin/into.obsidian/plugins/terrain-graph/in your vault - Obsidian → Settings → Community plugins → enable Terrain Graph
- Open the view from the left sidebar icon, or run the command "Open terrain graph"
BRAT
Install BRAT and add this repository.
Usage & Settings
Click the gear button in the top-right of the view to open the settings panel:
| Setting | Description |
|---|---|
| Levels | Number of contour levels (altitude layers) |
| Mountain width | Horizontal width of each mountain (Gaussian bandwidth) |
| Min links | Notes below this degree are demoted in display |
| Ghost low-degree nodes | Keep low-degree notes as faint dots |
| Show attachments / orphans / unresolved | Which node types appear (mirrors the official graph) |
| Docs / Names | Show document markers and name labels |
| Highlight selection | Light up direct neighbors when a node is selected |
| Relayout / Reset | Re-run the force layout / restore defaults |
Interactions: drag to rotate, scroll to zoom, double-click to reset, click to pin a selection (gold 1-hop highlight), right-click to deselect, hover for a note card. The bottom-right corner shows the selected note and node/edge/group/level statistics.
Development
cd plugin
npm install
npm run build    # type-check + bundle main.js
npm run dev      # watch mode
main.js bundles d3-force, so there are no runtime dependencies to install separately.
Structure
terrain-graph/
├── plugin/              # Obsidian plugin
│   ├── manifest.json
│   ├── main.js          # build output
│   ├── styles.css
│   └── src/             # TypeScript source
│       ├── main.ts      # plugin entry, settings panel, view registration
│       ├── graph.ts     # graph building, community detection
│       ├── terrain.ts   # force layout, height field, contours
│       ├── render.ts    # 3D rendering, interactions
│       └── everest.ts   # Everest-region DEM data
├── docs/                # screenshots
├── LICENSE
└── README.md
Credits
- Layout engine d3-force (MIT)
- DEM data from SRTM (Everest region)
License
MIT