
README file from
GithubTag Graph
A graph view for Bases where tags, folders and properties are the nodes — and where you tag, retag and merge by dragging.
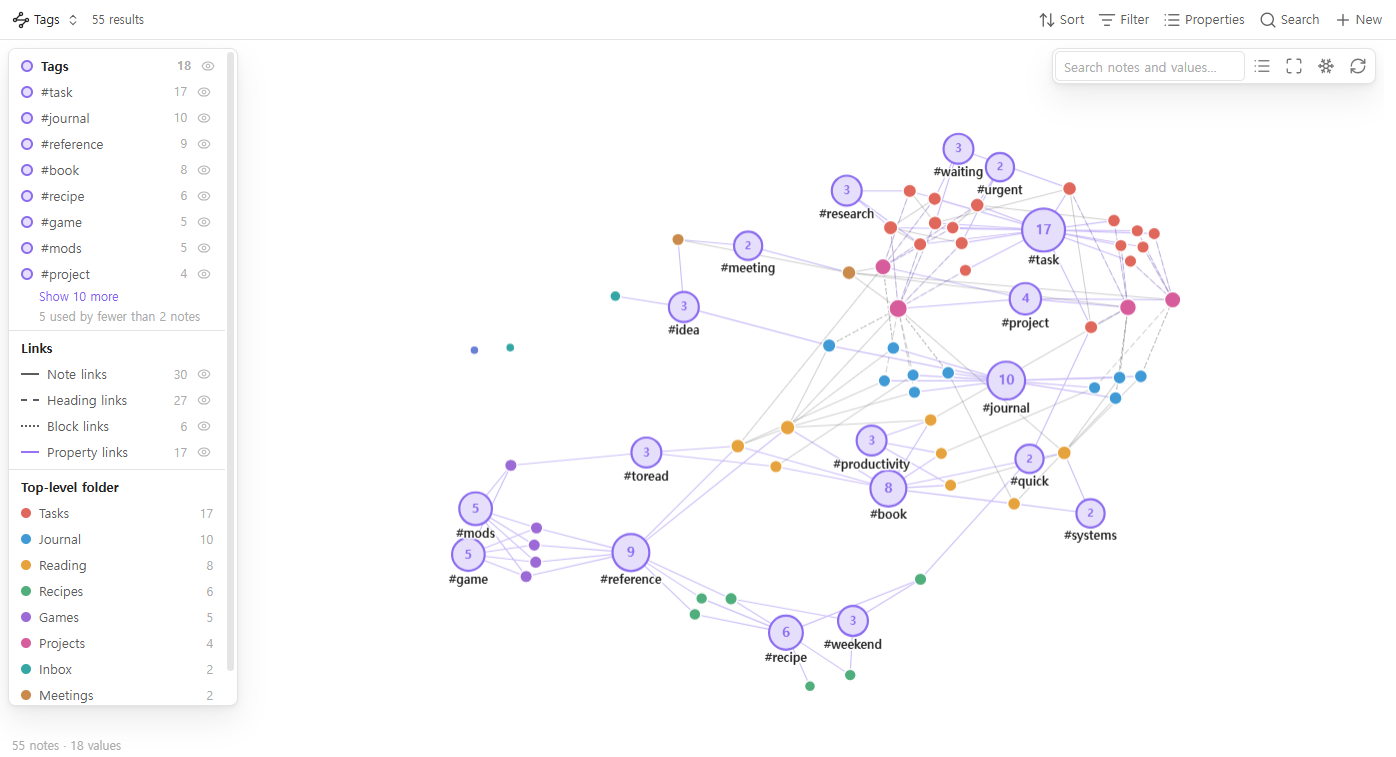
Every tag (or folder, or status, or project, or any property) becomes a hub,
and every note that has it is pulled towards it. Notes that never link to each
other still end up side by side when they share a tag, so a vault held together
by tags and properties finally has a shape you can see. And the graph is not
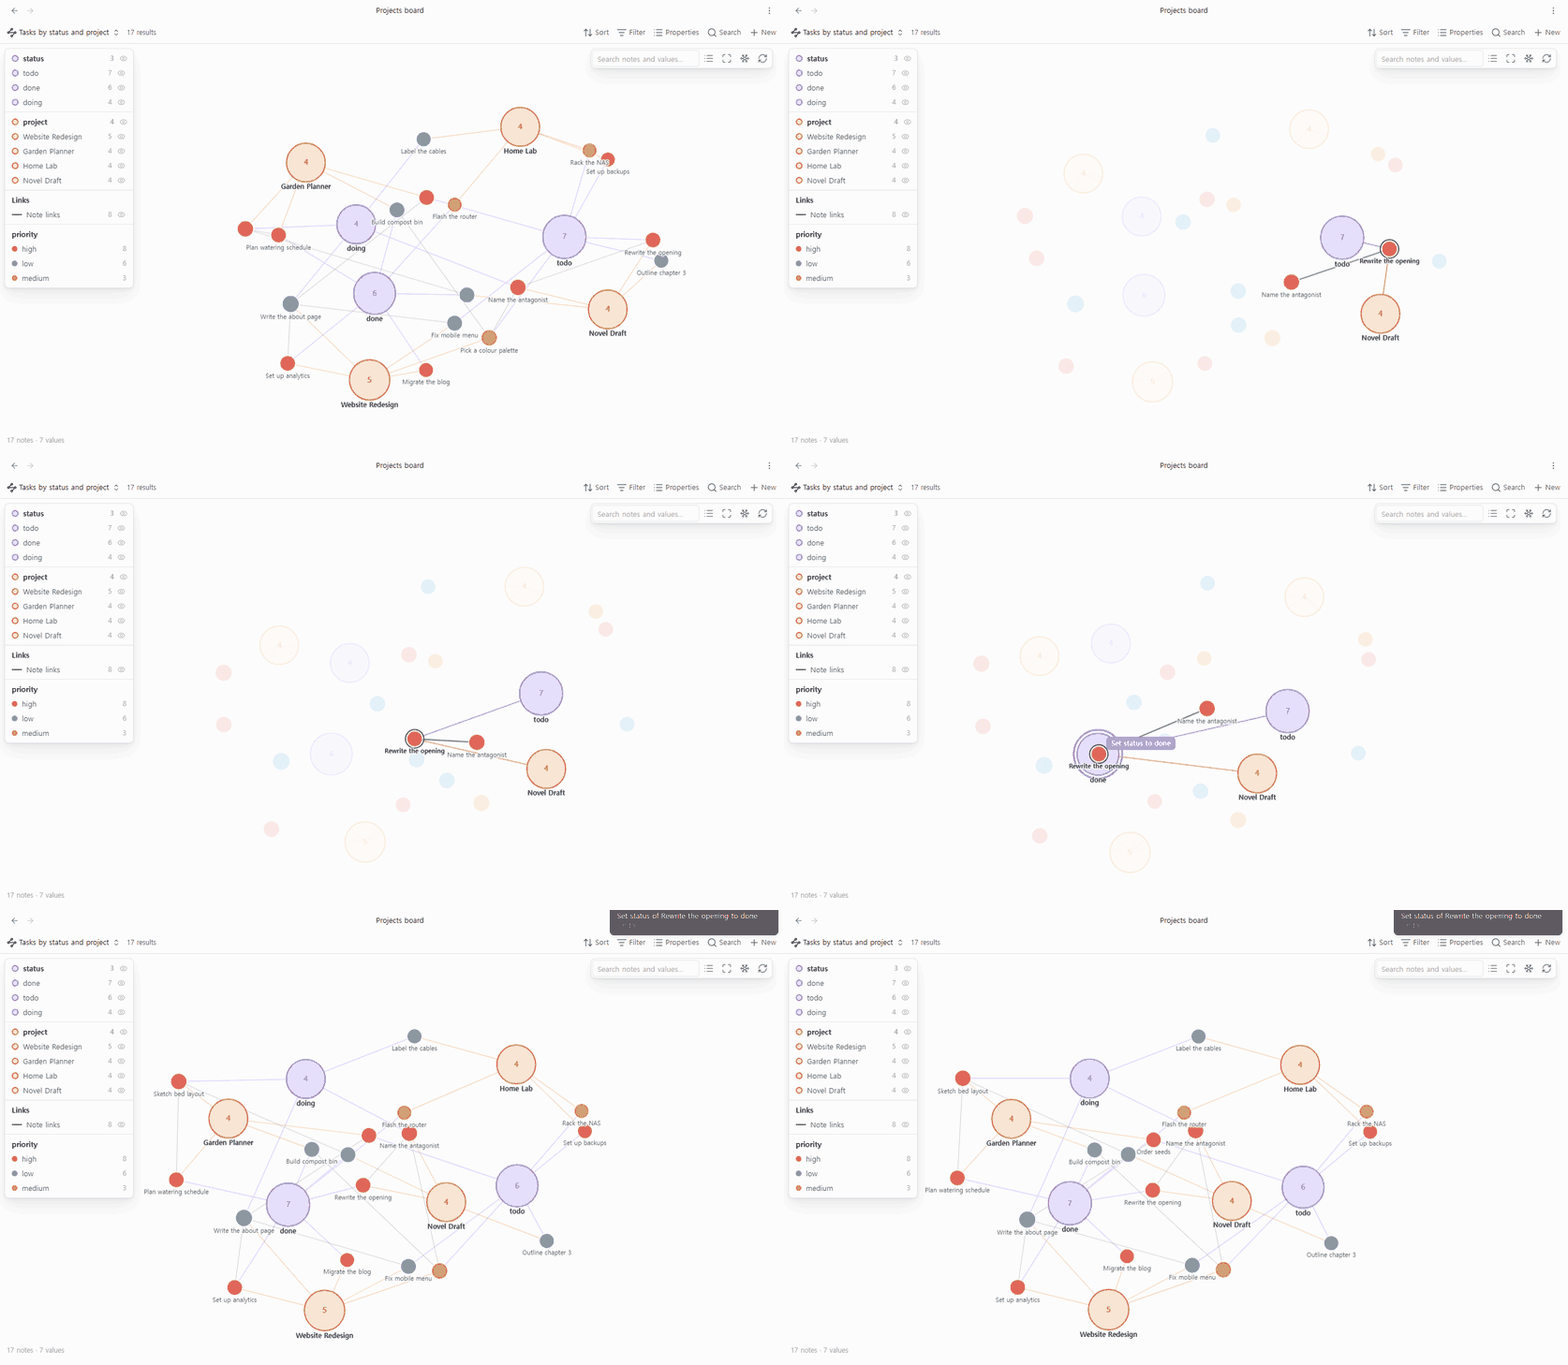
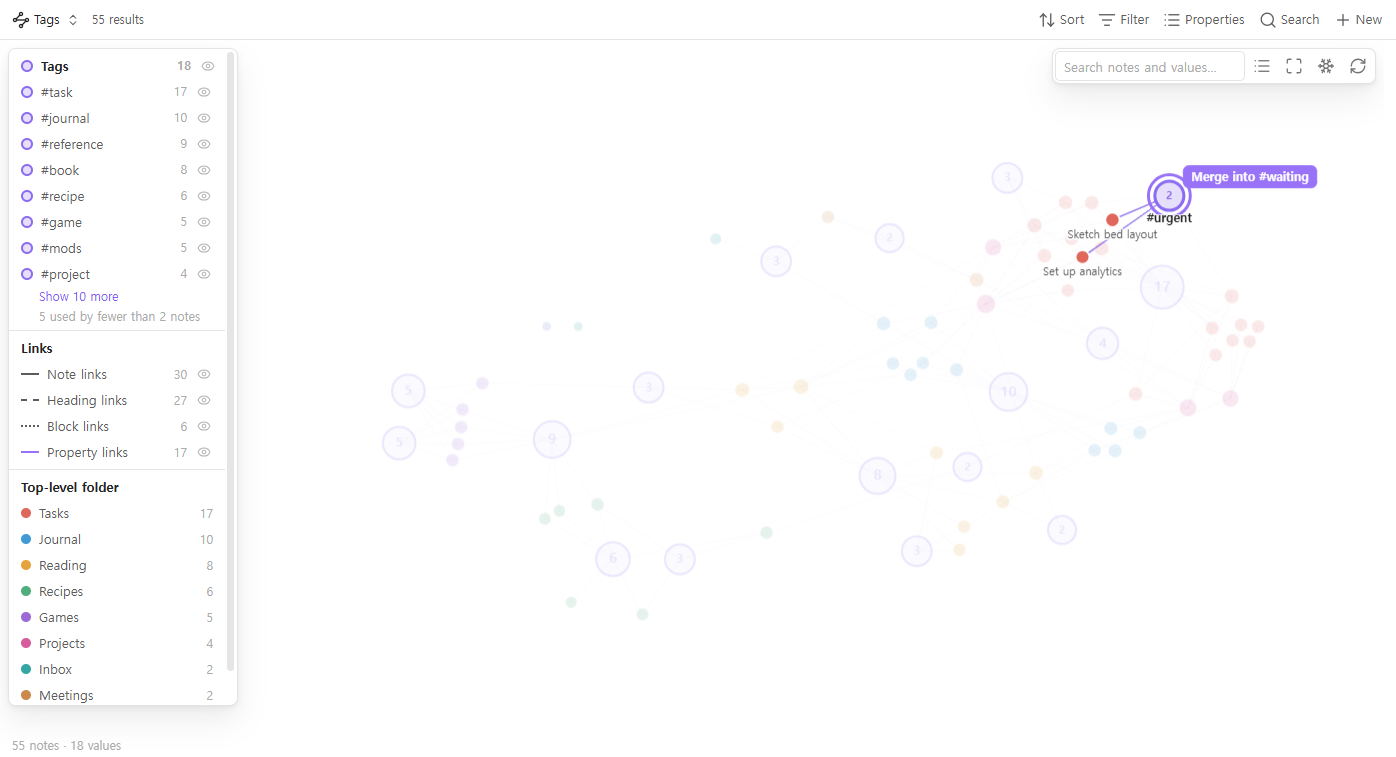
read-only: drop a note on a tag to tag it, drop one tag on another to merge them.
Built from what people asked for
Tag Graph started from reading six months of feature requests on the Obsidian forum (April–October 2026) and collecting the graph and tag requests that were still open. Each row is a real thread; the right column is what Tag Graph does about it.
| What people asked for | What Tag Graph does |
|---|---|
| Filter the graph by tag frequency — hide tags used only once, so typo tags stop cluttering the graph | Hide values used by fewer notes than n (default 2). The legend says how many were hidden. |
Folder-aware tags — see which folder a reused tag like #toread was used in, without typing #games/toread by hand |
Split values by folder: one hub for the tag, plus a sub-hub for each folder it is used in. |
| Toggle graph groups on and off quickly | An eye icon on every tag and every property in the legend. Click a tag to highlight its notes. |
| Multi-coloured nodes — a note with several tags should show all their colours | A pie slice per value, up to four. |
| Tell heading and block links apart · hide frontmatter links | Note, heading ([[a#b]]), block ([[a#^c]]), property and embed links are drawn differently, and each kind can be switched off. |
| Search that highlights instead of hiding | Matches get a ring, the rest stays on screen, dimmed. Enter zooms to the matches. |
| Freeze the graph — stop it rearranging itself | A seeded layout that opens the same way every time, edits that only move the note you changed, and a Freeze button. |
| Use Bases filters in the graph instead of typing search syntax | It is a Bases view: the base's filters decide what is drawn. Graph one project, one folder or one query. |
| A graph view you can work in · a quicker way to add tags | Drag to tag. Drop notes on tags and properties to change them, merge tags by dropping one on another — see below. |
Drag to tag
The graph is a way to change your notes, not only to look at them.
| Drag | onto | does |
|---|---|---|
| a note | a tag or value | adds it (a list property gets it appended; a single-value property like status is set to it) |
| a note | a folder | moves the note into that folder |
| a note | a note that is a value (e.g. a project note) | sets that property to a link to it |
| a note | another note, holding Alt or Ctrl (⌥ or ⌘ on a Mac) | adds a link to the other note in a property you choose (related by default). Without the key nothing is linked, so a note you pass over on the way is safe; on a phone or tablet no key is needed |
| a tag | another tag | merges them: every note in the base gets the second tag instead of the first |
| a folder | another folder | moves the folder, with everything in it, into the other one (turn on Move folders by dragging first) |
Right-click a tag or value to rename it across the notes in the base — in
the tags property and in #tags written in the note text — or to create a
new note that already has it, or remove it from all notes. Right-click a
note to remove one of its tags or values, move it to the vault root,
rename it or delete it. Right-click a folder to create a note in it,
rename it or delete it, and empty space for a new note. Deleting always asks
first and goes to the trash your Deleted files setting chooses.
The same two things work from the keyboard on the node you clicked: Remove the selected tag or property from all notes and Delete the selected note or folder are commands with no hotkey of their own, so you can bind them to Delete (or anything else) in Settings → Hotkeys.
Every edit shows a notice with Undo, and Undo last edit is a command too. Undo only goes ahead if the files are still exactly as the edit left them.
Details: what a tag is doing
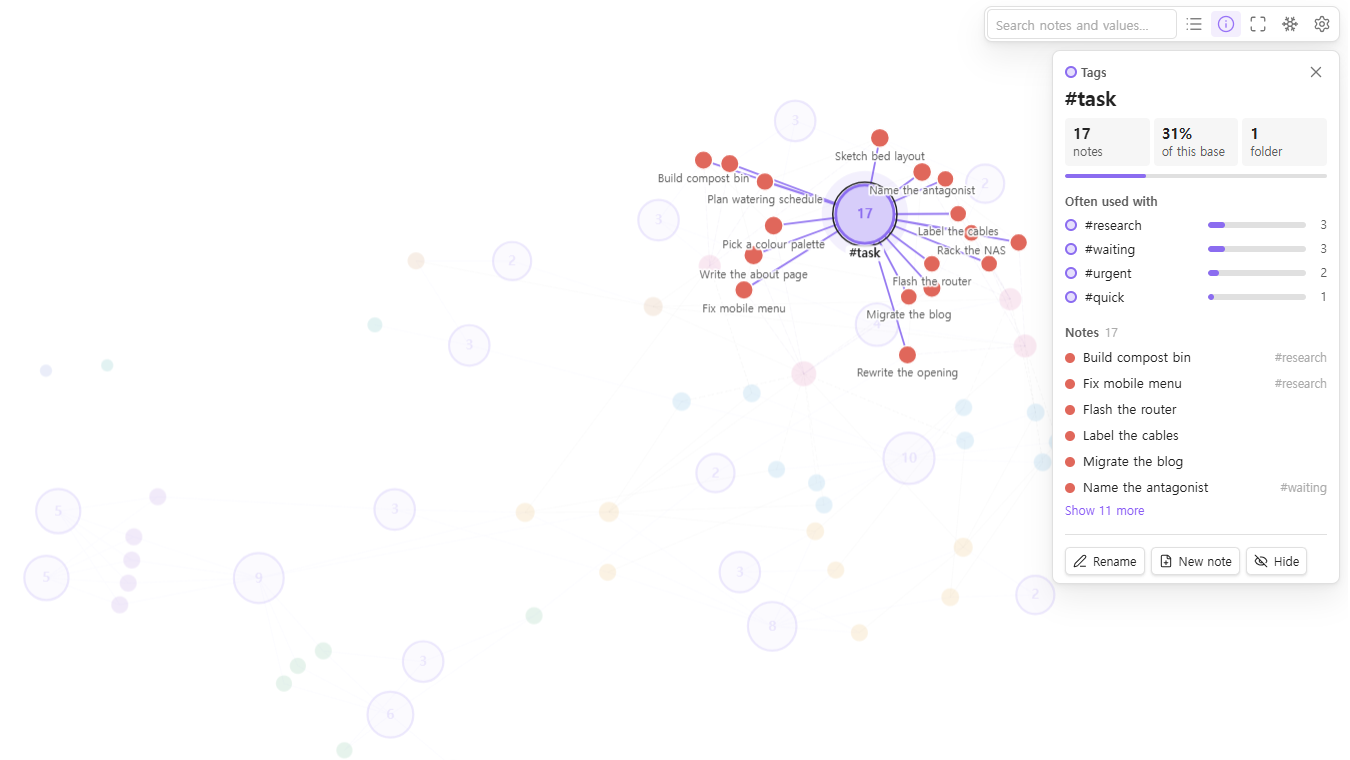
Click a tag (or any value) and a details panel says what the graph only hints at:
- How much — how many notes have it, and what share of the base that is.
- How alive — when it was last edited, in which note, and how many of its notes changed in the last 30 days.
- Where — which folders it is used in, with a bar for each. Hover a folder to light just those notes.
- What it comes with — the values most often used on the same notes
(
#task→#waiting,#urgent…). Click one to fly to it. - Which notes — the list, each with its other tags, sorted by name, by most recently edited, or by folder: one heading per folder the value is used in, in name order, each with its own count and a fold arrow. Hover a note to find it on the graph, click to open it.
- Possibly the same value —
#recipesnext to#recipe,#to-readnext to#toread,#jounralnext to#journal, with a Merge button. - Rename, New note and Hide buttons.
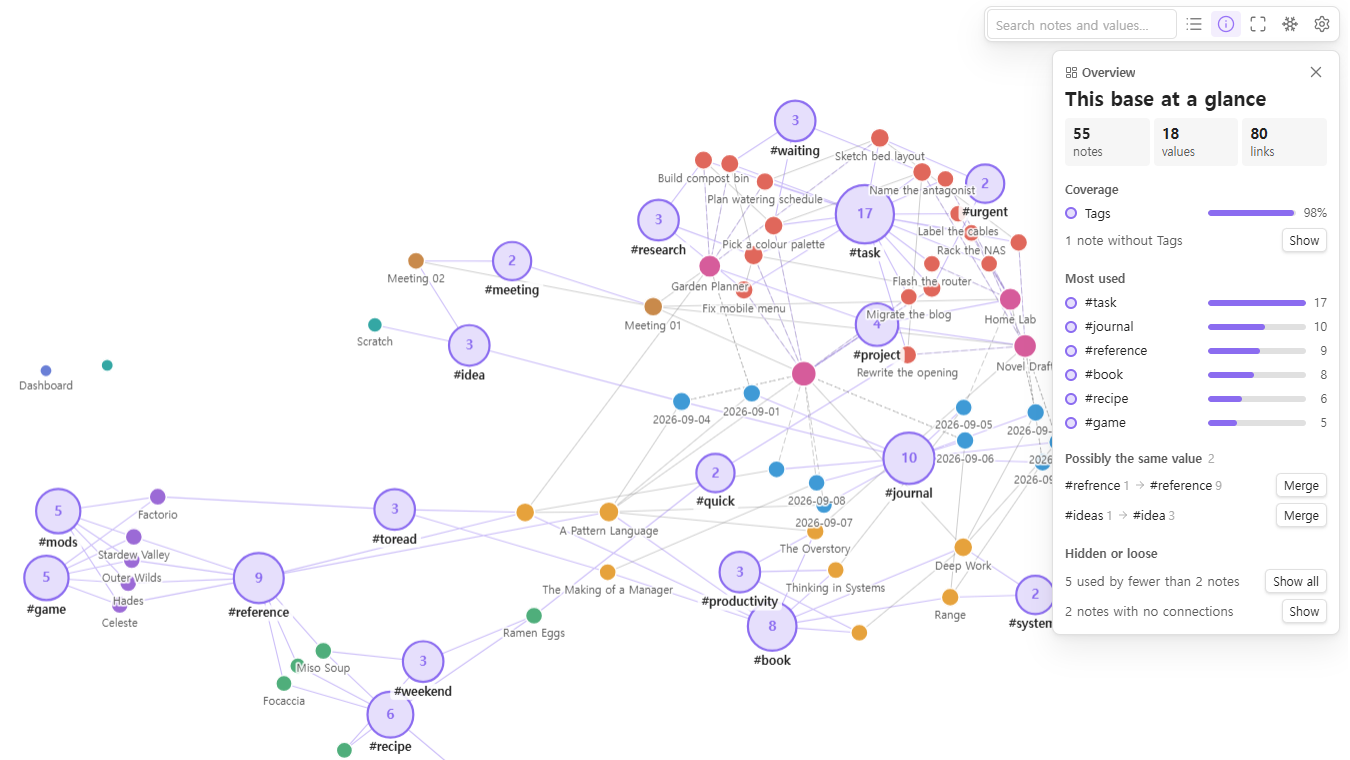
The ⓘ button with nothing selected shows the whole base at a glance: how many notes have each property (and a button that lights the ones that do not — your untagged notes), the most used values, every look-alike pair, values hidden as rare, and notes with no connections.
Right-click a note and choose Details for its values, its links in and out, and the notes it shares the most with — a rare shared tag counts for more than a common one.
More than tags
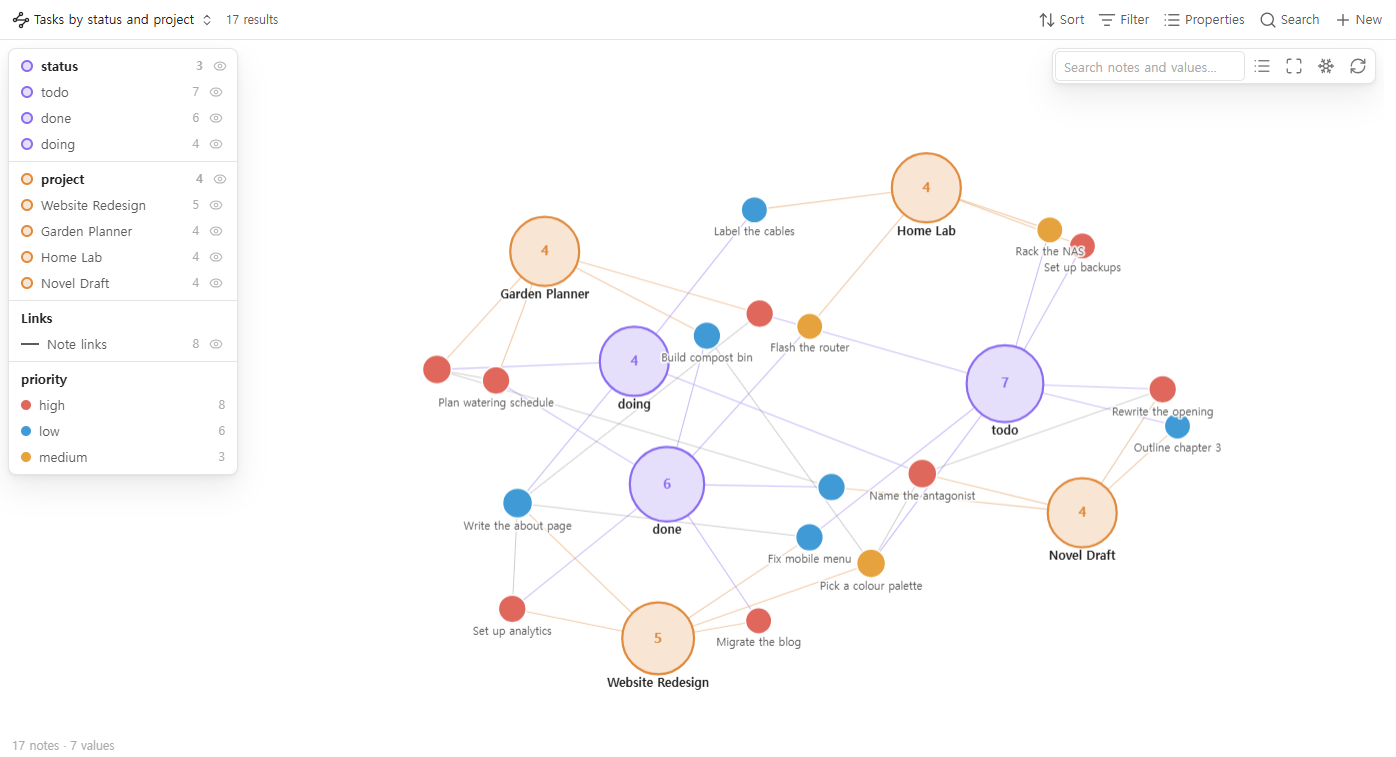
Tags are the first hub property, but you can pick up to four: any note property
(status, project, author, area…), formulas, file.folder or file.ext.
A property that holds links, such as project: "[[Home Lab]]", joins its notes
straight to the project note when that note is in the graph.
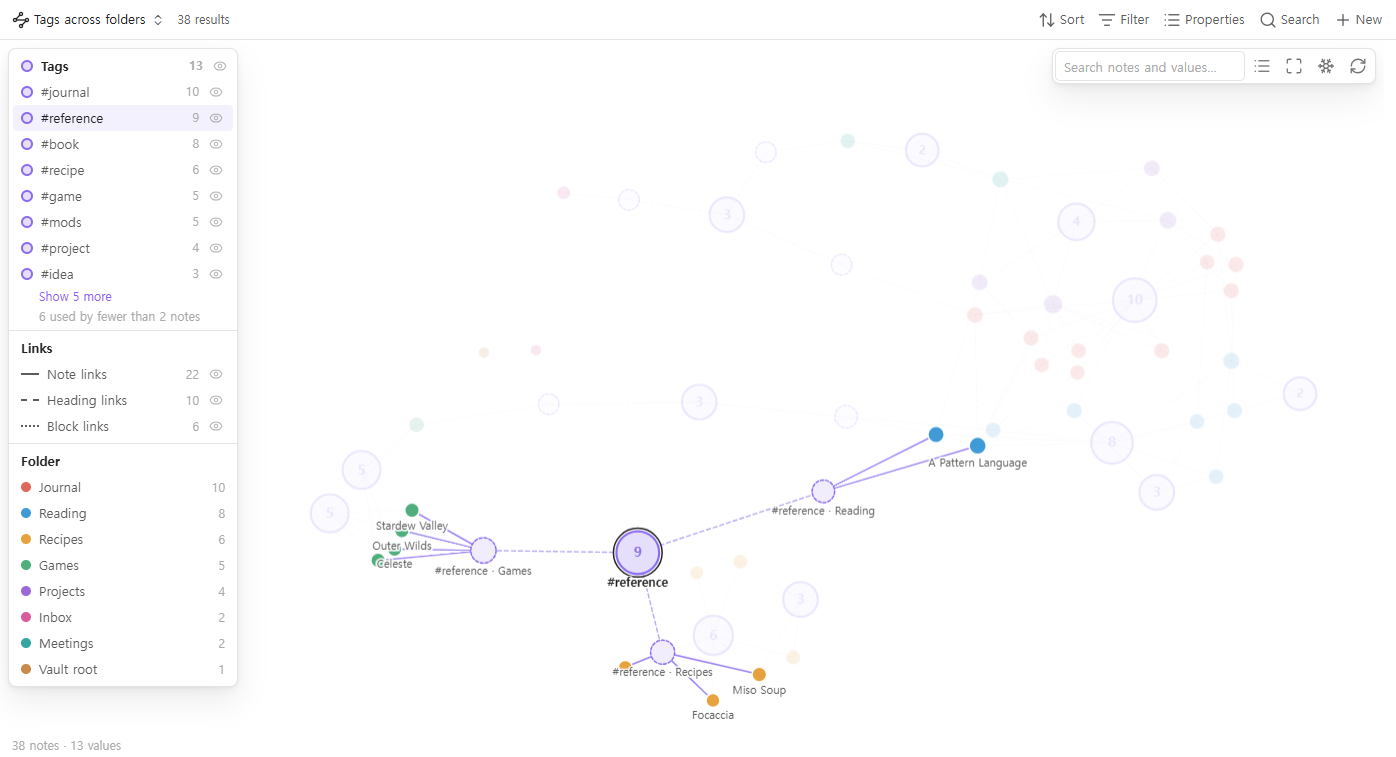
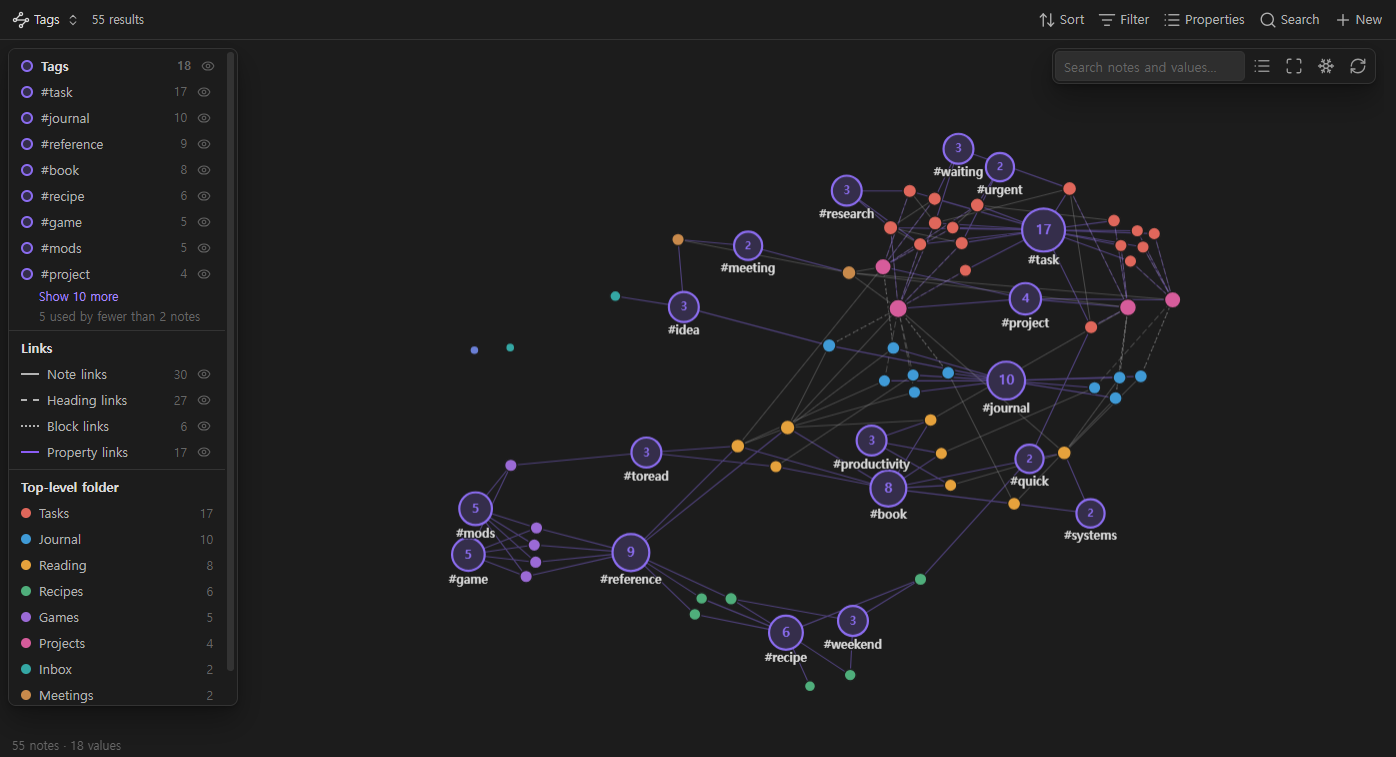
Notes are coloured by any property you choose, by the base's grouping, or — by default — by top-level folder, so where a note lives shows at a glance.
It follows your theme, light or dark:
Getting started
- Install Tag Graph from Settings → Community plugins. The Bases core plugin must be on (Settings → Core plugins → Bases): with it off, a base opens as an empty tab, and the command below says so.
- Run Tag Graph: Create a base with a tag graph from the command palette.
Or open any
.basefile, select Add view, and choose Tag graph. - That's it: tags are the hubs until you pick other hub properties in the view options.
Using the graph
- Click a note to open it (Ctrl/Cmd-click: new tab). Ctrl/Cmd-hover for a page preview.
- Click a tag to highlight its notes and open its details. Double-click it to zoom to them. The same works in the legend, and hovering a legend row previews its notes on the graph.
- Search lists matching values and notes as you type; ↑/↓ and Enter fly to one. Enter with nothing picked zooms to every match.
- Hover a node and its connections fade in while the rest fades back — quickly, but without a jolt.
- Drag to edit. While you drag, the note's own connections stay highlighted and the target under the pointer holds still.
- Scroll to zoom, drag the background to pan. Esc cancels a drag and clears the highlight.
- Keys on the graph: / search, i details, f fit, +/- zoom, ←/→ through the values (biggest first), ↑/↓ through what the focused node is joined to — each step shows its details.
- Motion says what changed: the graph blooms in hubs first, a highlight spreads out from what you clicked, a drop draws the link it will make before you let go, and new nodes pop in where an edit put them. Animate the layout off — or your system's reduced-motion setting — keeps it all still.
- On a phone or tablet: pinch to zoom, tap a note to see its tags, tap again to open it, long-press for the menu.
View options
| Option | Default | |
|---|---|---|
| Property 1–4 | Tags, none, none, none | Note properties, formulas, file.tags, file.folder, file.ext |
| Hide values used by fewer notes than | 2 | A value that is itself a note in the graph is always drawn |
| Split values by folder | off | |
| Link folders to their parent folder | off | Draws folders as trees; a parent with no notes of its own is drawn too |
| Show folder names, not paths | off | |
| Colour notes by | grouping, else top-level folder | |
| Show notes with no connections | on | |
| Note dropped on note links it in | related |
Leave empty to switch off |
Graph settings
The gear button in the graph's toolbar opens the controls you know from
Obsidian's own graph view, with the same ranges and defaults. Changes show
while you drag a slider and are saved with the view, in the .base file.
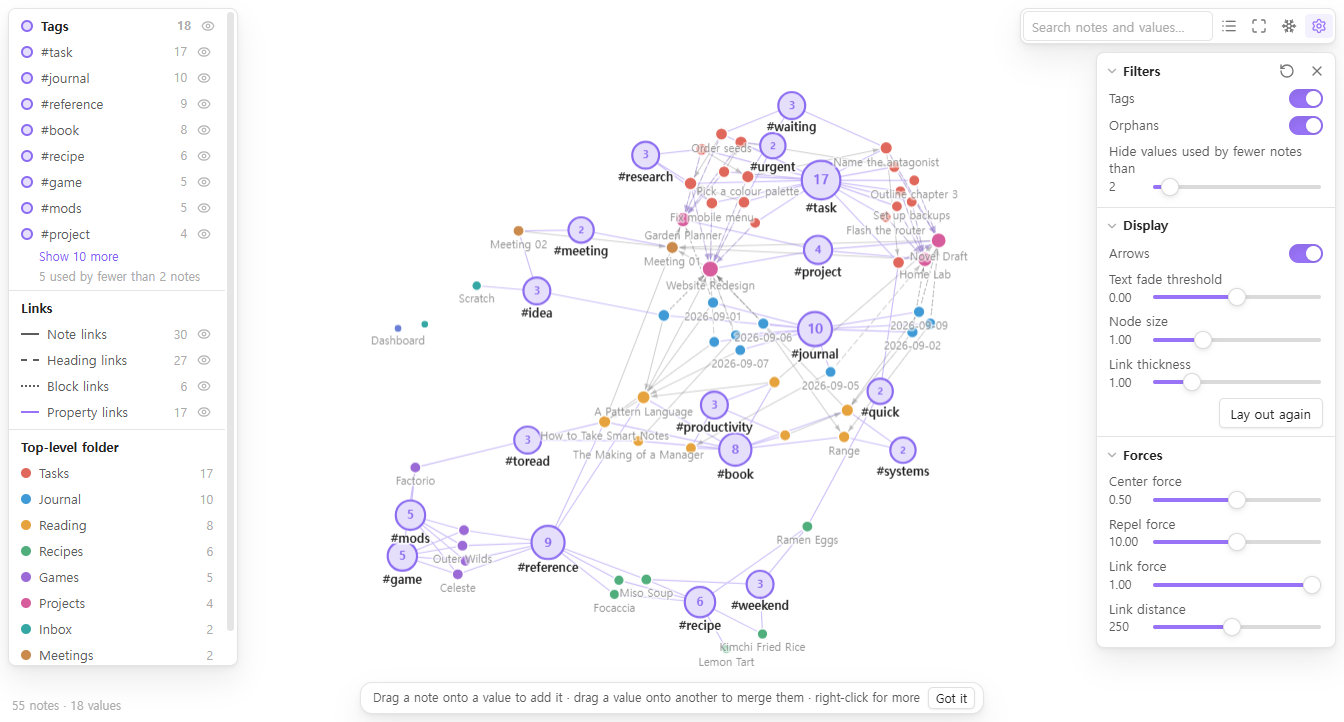
| Section | Controls |
|---|---|
| Filters | Each hub property on or off (e.g. Tags), orphans, the rare-value cut-off |
| Display | Arrows (on note-to-note links; both ways when the notes link each other), text fade threshold, node size, link thickness, lay out again |
| Forces | Center force, repel force, link force, link distance |
The ↻ button puts every control back to its default.
Settings
- Language (Follow Obsidian) — English, 한국어 or 中文. Open graphs switch at once; command names and the view's name in the Bases menu follow after Obsidian restarts.
- Confirm before changing many notes (on) — before a merge that touches more than one note.
- Confirm before moving files (on) — before a drop on a folder moves a note or a folder.
- Move folders by dragging (off) — drop a folder on another folder to move it there. Everything inside moves too, including notes outside the base. Off by default so a folder is not moved by accident.
- Change tags in the note text too (on) — renames, merges and removals also
change
#tagsin the body, not only thetagsproperty. Only the exact tag is changed:#todo/subis a different tag from#todo. - Animate the layout (on) — off lays the graph out before showing it and then keeps it still.
- Show the editing hint (on).
The interface is in English, Korean and Simplified Chinese, following Obsidian's language unless you choose one under Language.
What it touches
- Reads the notes the base returns, and their metadata from Obsidian's cache.
- Writes only when you drop, rename, merge, remove or create — and only to
the notes the base returns. A rename never reaches notes outside the base.
Frontmatter is changed through Obsidian's own
processFrontMatter; moves go through Obsidian's file manager, so links are updated as your settings say. - No network. The plugin makes no requests and loads no code at runtime.
d3-force is bundled into
main.js.
Limits
- Calculated values (formulas, and file properties other than tags and folder) are drawn but cannot be changed by dragging.
- Undo covers the last edit only.
- Built for bases of up to a few thousand notes. On 3,000 notes the first layout takes about a quarter of a second.
中文
Tag Graph 是一个 Bases 视图:标签、文件夹和属性成为图谱中的中心节点,带有同一个标签的笔记会聚在一起,即使它们之间没有任何链接。图谱也不是只读的:把笔记拖到标签上就能加上标签,把一个标签拖到另一个标签上就能合并。
- 拖动即编辑:给笔记加标签或设置属性,合并、重命名标签,把笔记移到文件夹。最近一次修改可以撤销。
- 详情面板:点击标签,查看有多少笔记在用它、用在哪些文件夹、常和哪些值一起出现,以及可能重复的标签。
- 整理:隐藏少用的标签,按文件夹拆分标签,区分笔记、标题、块、属性链接和嵌入。
- 由 Bases 的筛选决定画什么:只看一个项目、一个文件夹或一个查询。
- 界面支持 中文 · English · 한국어。默认跟随 Obsidian 的语言,也可以在 设置 → Tag Graph → 语言 中切换。
- 不发出任何网络请求。桌面端和移动端都能用。
安装:设置 → 第三方插件 → 浏览 → 搜索 “Tag Graph”,并开启核心插件 Bases。然后在命令面板中运行 “创建带标签图谱的 Base”。
One-time message
After you update Tag Graph, the first time you open a graph view yourself, a small window asks you to star this repository on GitHub if you find the plugin useful. It appears only for people who updated (never on a fresh install) and never at start-up. Press its star button and it never appears again; otherwise each design of the window is shown at most once (the redesigned window from 1.8.1 is shown once more to people who saw the first one). Its button opens the repository in your browser only when you press it, and nothing in the plugin depends on it. There are no other messages or ads.
More from the same author
- Vault Orrery: your vault as a 3D galaxy, where every folder is a solar system. Replay how it grew, note by note.
- Vault Pet: a pixel cat that lives at the bottom of your workspace and levels up as you write.
- Class Timetable: a weekly class timetable for students, with each class's lecture notes one click away. Desktop and mobile.
- Download Pulse: download stats for plugin authors: every plugin's downloads, rank and milestones in one dashboard.
Feedback
Found a bug, or a request this should answer? Open an issue.
Building
npm install
npm test
npm test type-checks, builds main.js, runs the unit tests in
scripts/test.mjs (graph model and frontmatter edits) and checks the bundle for
network calls, innerHTML, console.log and manifest consistency.
npm run demo-vault -- <dir> writes the sample vault used for the screenshots.
License
MIT © Elliott Park. Includes d3-force and its dependencies (ISC) — see THIRD-PARTY-NOTICES.md.