
README file from
GithubGiganttix
Visualise your task notes as a draggable Gantt chart in Obsidian
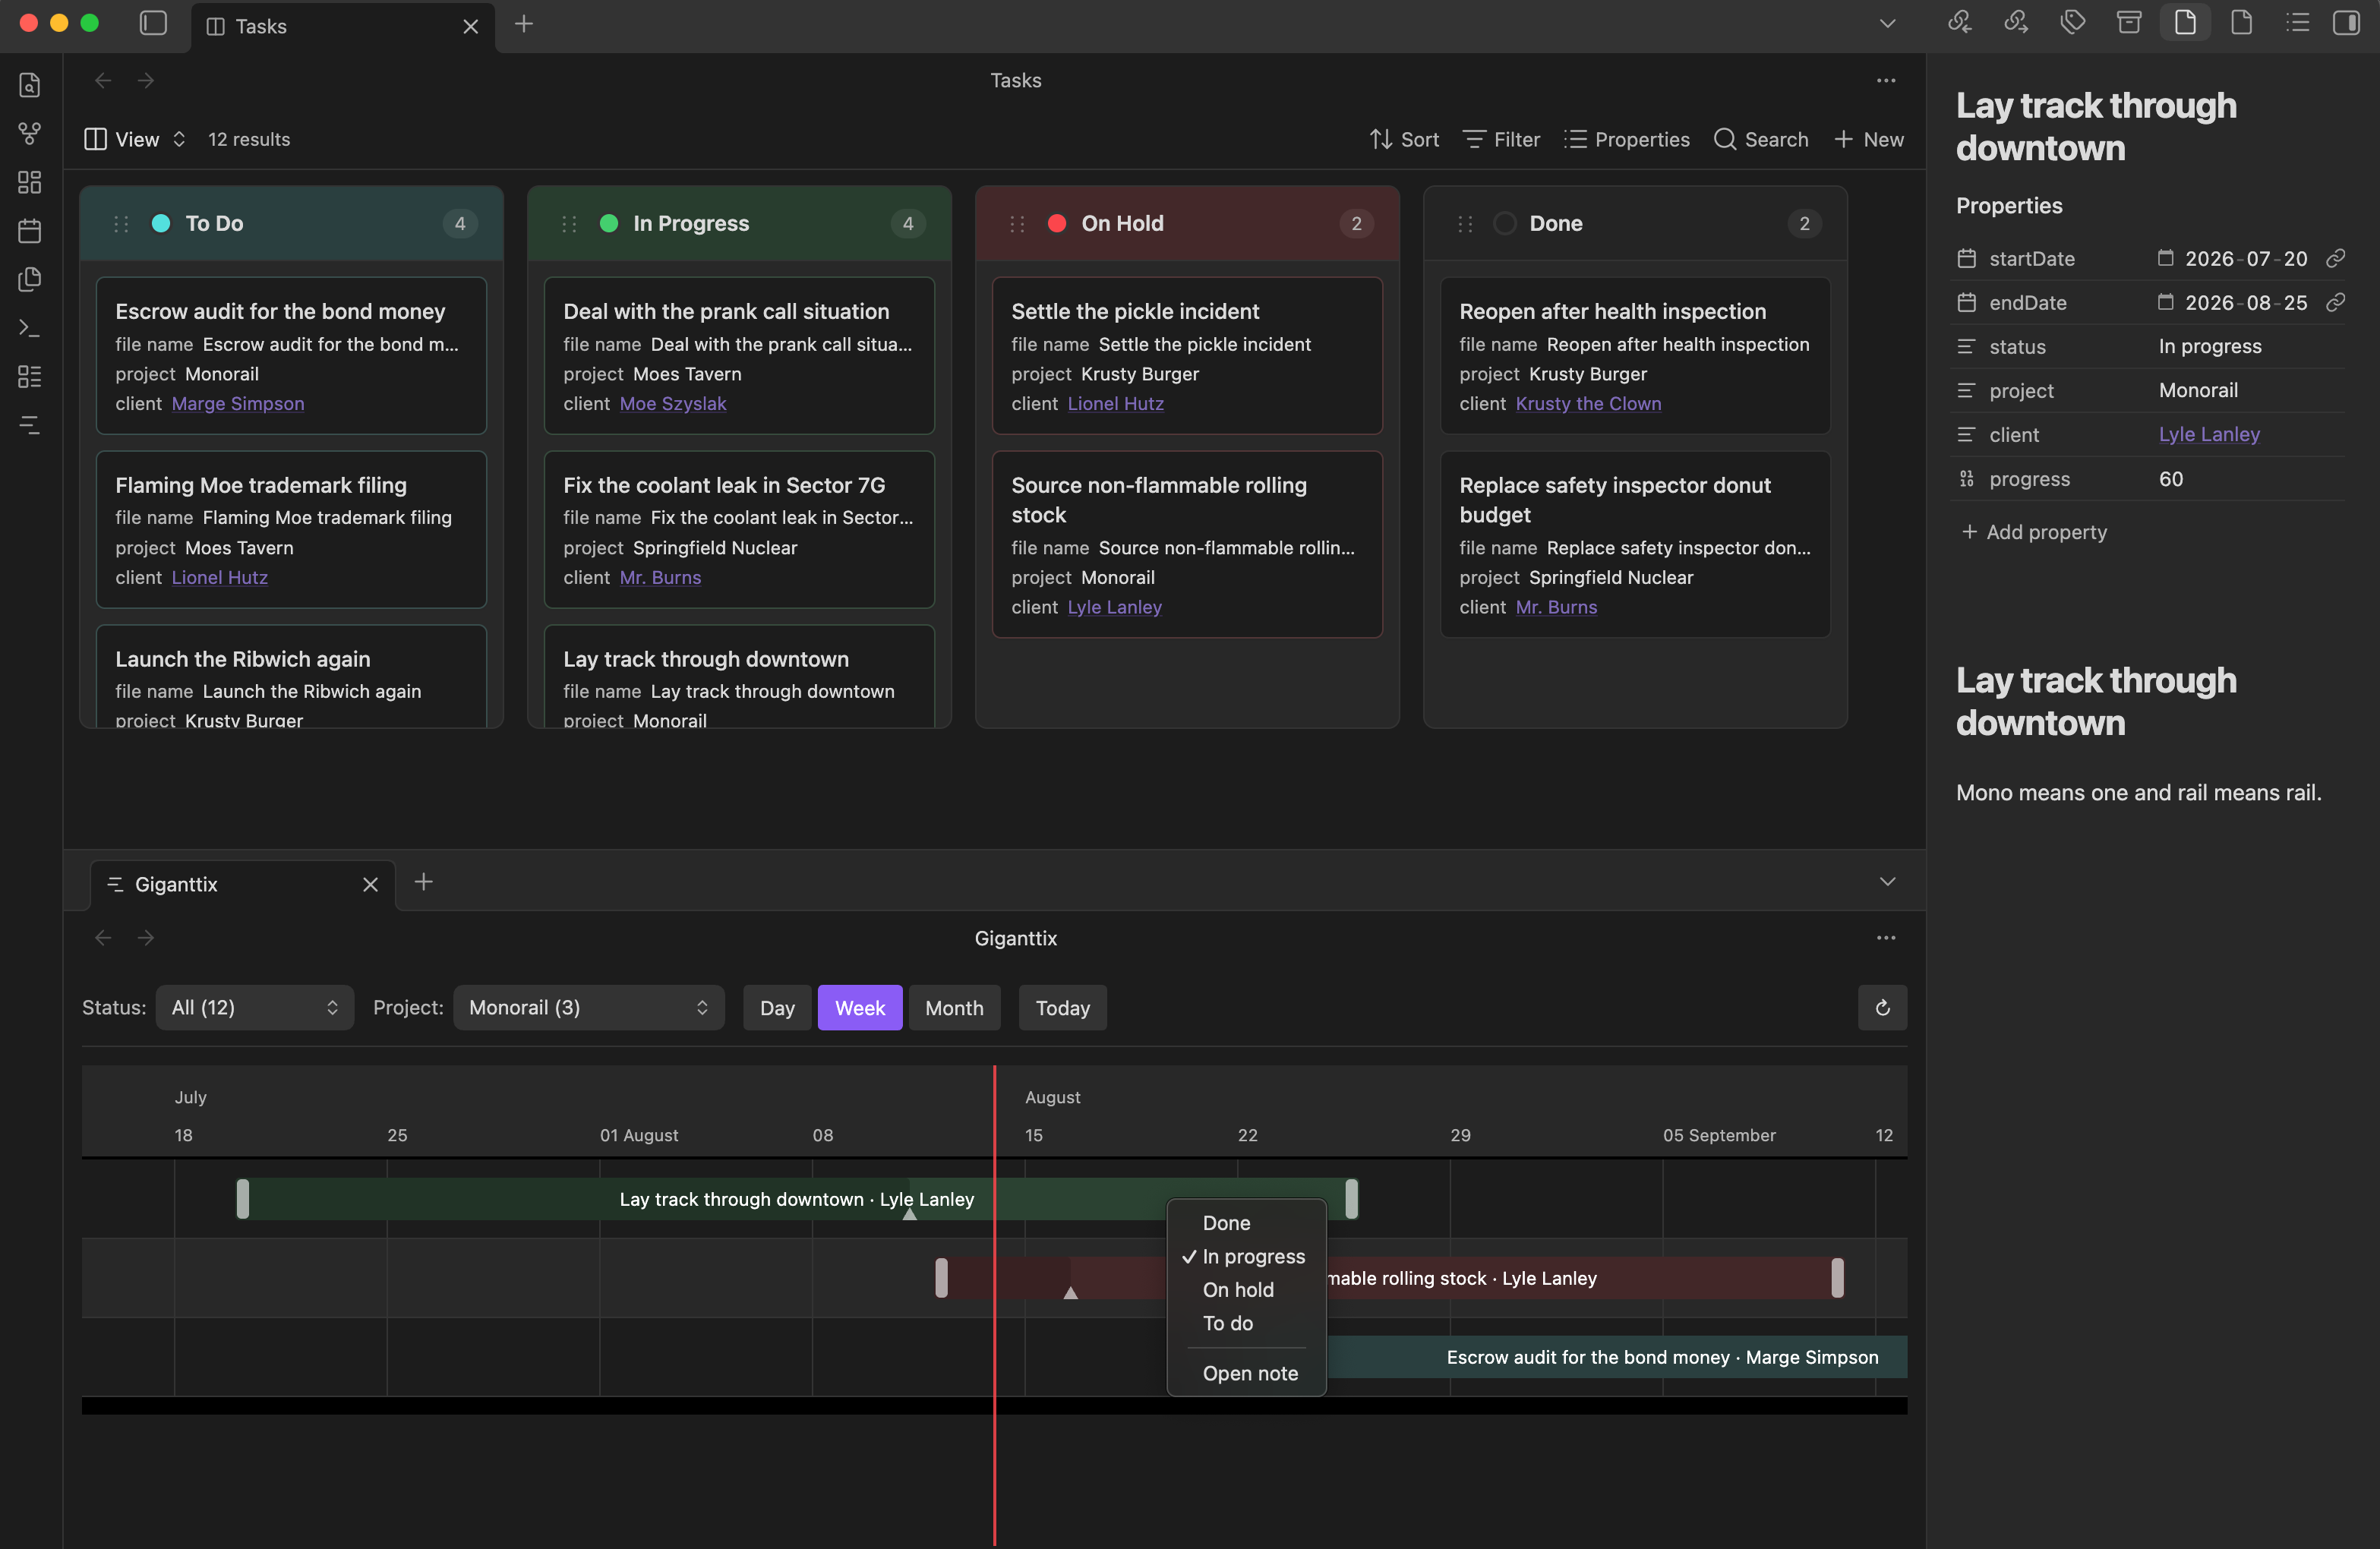
Giganttix scans your vault for notes with date frontmatter and renders them as an interactive timeline. Each note is one bar. Drag a bar to reschedule the task & the new dates are written back to the note's frontmatter. Click a bar to open the note in a new tab, right-click it to change its status.
Originally built to be viewed with a kanban board (external plugin or upcoming official kanban base core plugin).
How it works
Add dates to any note's frontmatter and it appears on the chart:
---
startDate: 2026-06-05
endDate: 2026-06-30
status: In progress
project: Springfield Nuclear
client: "[[Moe's Tavern]]"
progress: 40
---
| Field | Required | Notes |
|---|---|---|
startDate |
yes* | YYYY-MM-DD |
endDate |
yes* | same formats |
status |
no | powers the status filter and the right-click menu |
project |
no | powers the project filter (set the property name in settings) |
client |
no | shown after the task name |
progress |
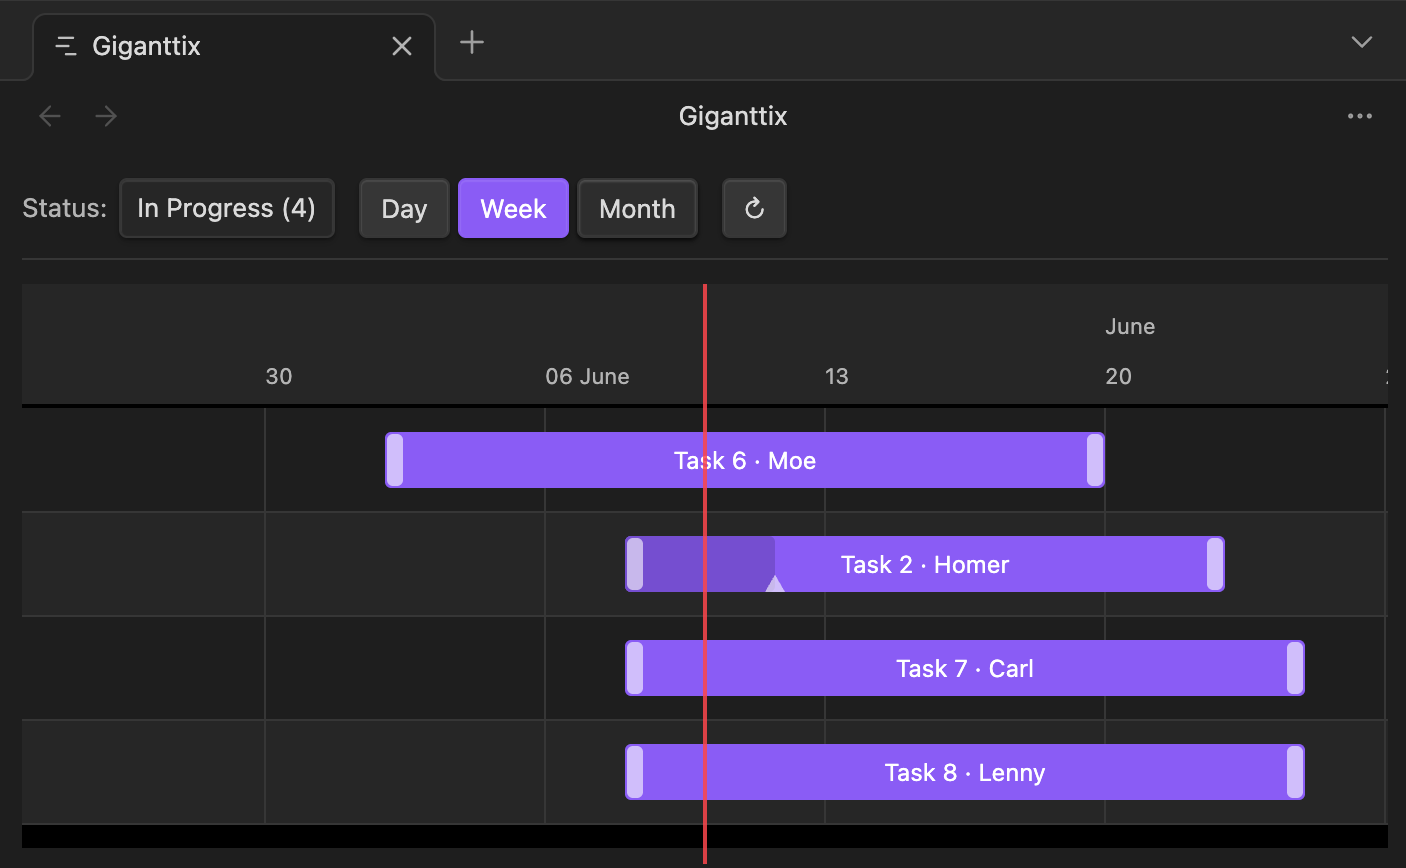
no | 0–100, rendered as a darker segment inside the bar |
Features
- Drag to reschedule : move or resize a bar; frontmatter updates atomically
- Drag the progress handle : hover a bar and drag the small handle to set % complete, written to
progress - Click a bar to open its note in a new tab (focuses the existing tab if it's already open)
- Right-click a bar to change its status without leaving the chart, or open the note
- Day, Week & Month views
- Today button to jump back to the current date
- Status filter built from your actual status values, with an "All" option to see everything at once
- Project/client filter : set a project property in settings and a second dropdown appears to filter by project
- Custom statuses : define your own status list in settings, with suggestions pulled from your notes as you type
- Custom date properties : use any frontmatter properties for start and end dates
- Tooltips : hover any bar for full name, client, dates, status, and progress
- Weekend shading in Day view
- Scope your tasks : limit the chart to a folder and/or require a frontmatter property (e.g. only notes with a
projectsproperty) - Status colors : keep the theme accent color, or assign a color per status in settings
Usage
Open the chart from the ribbon icon or the command palette.
Settings
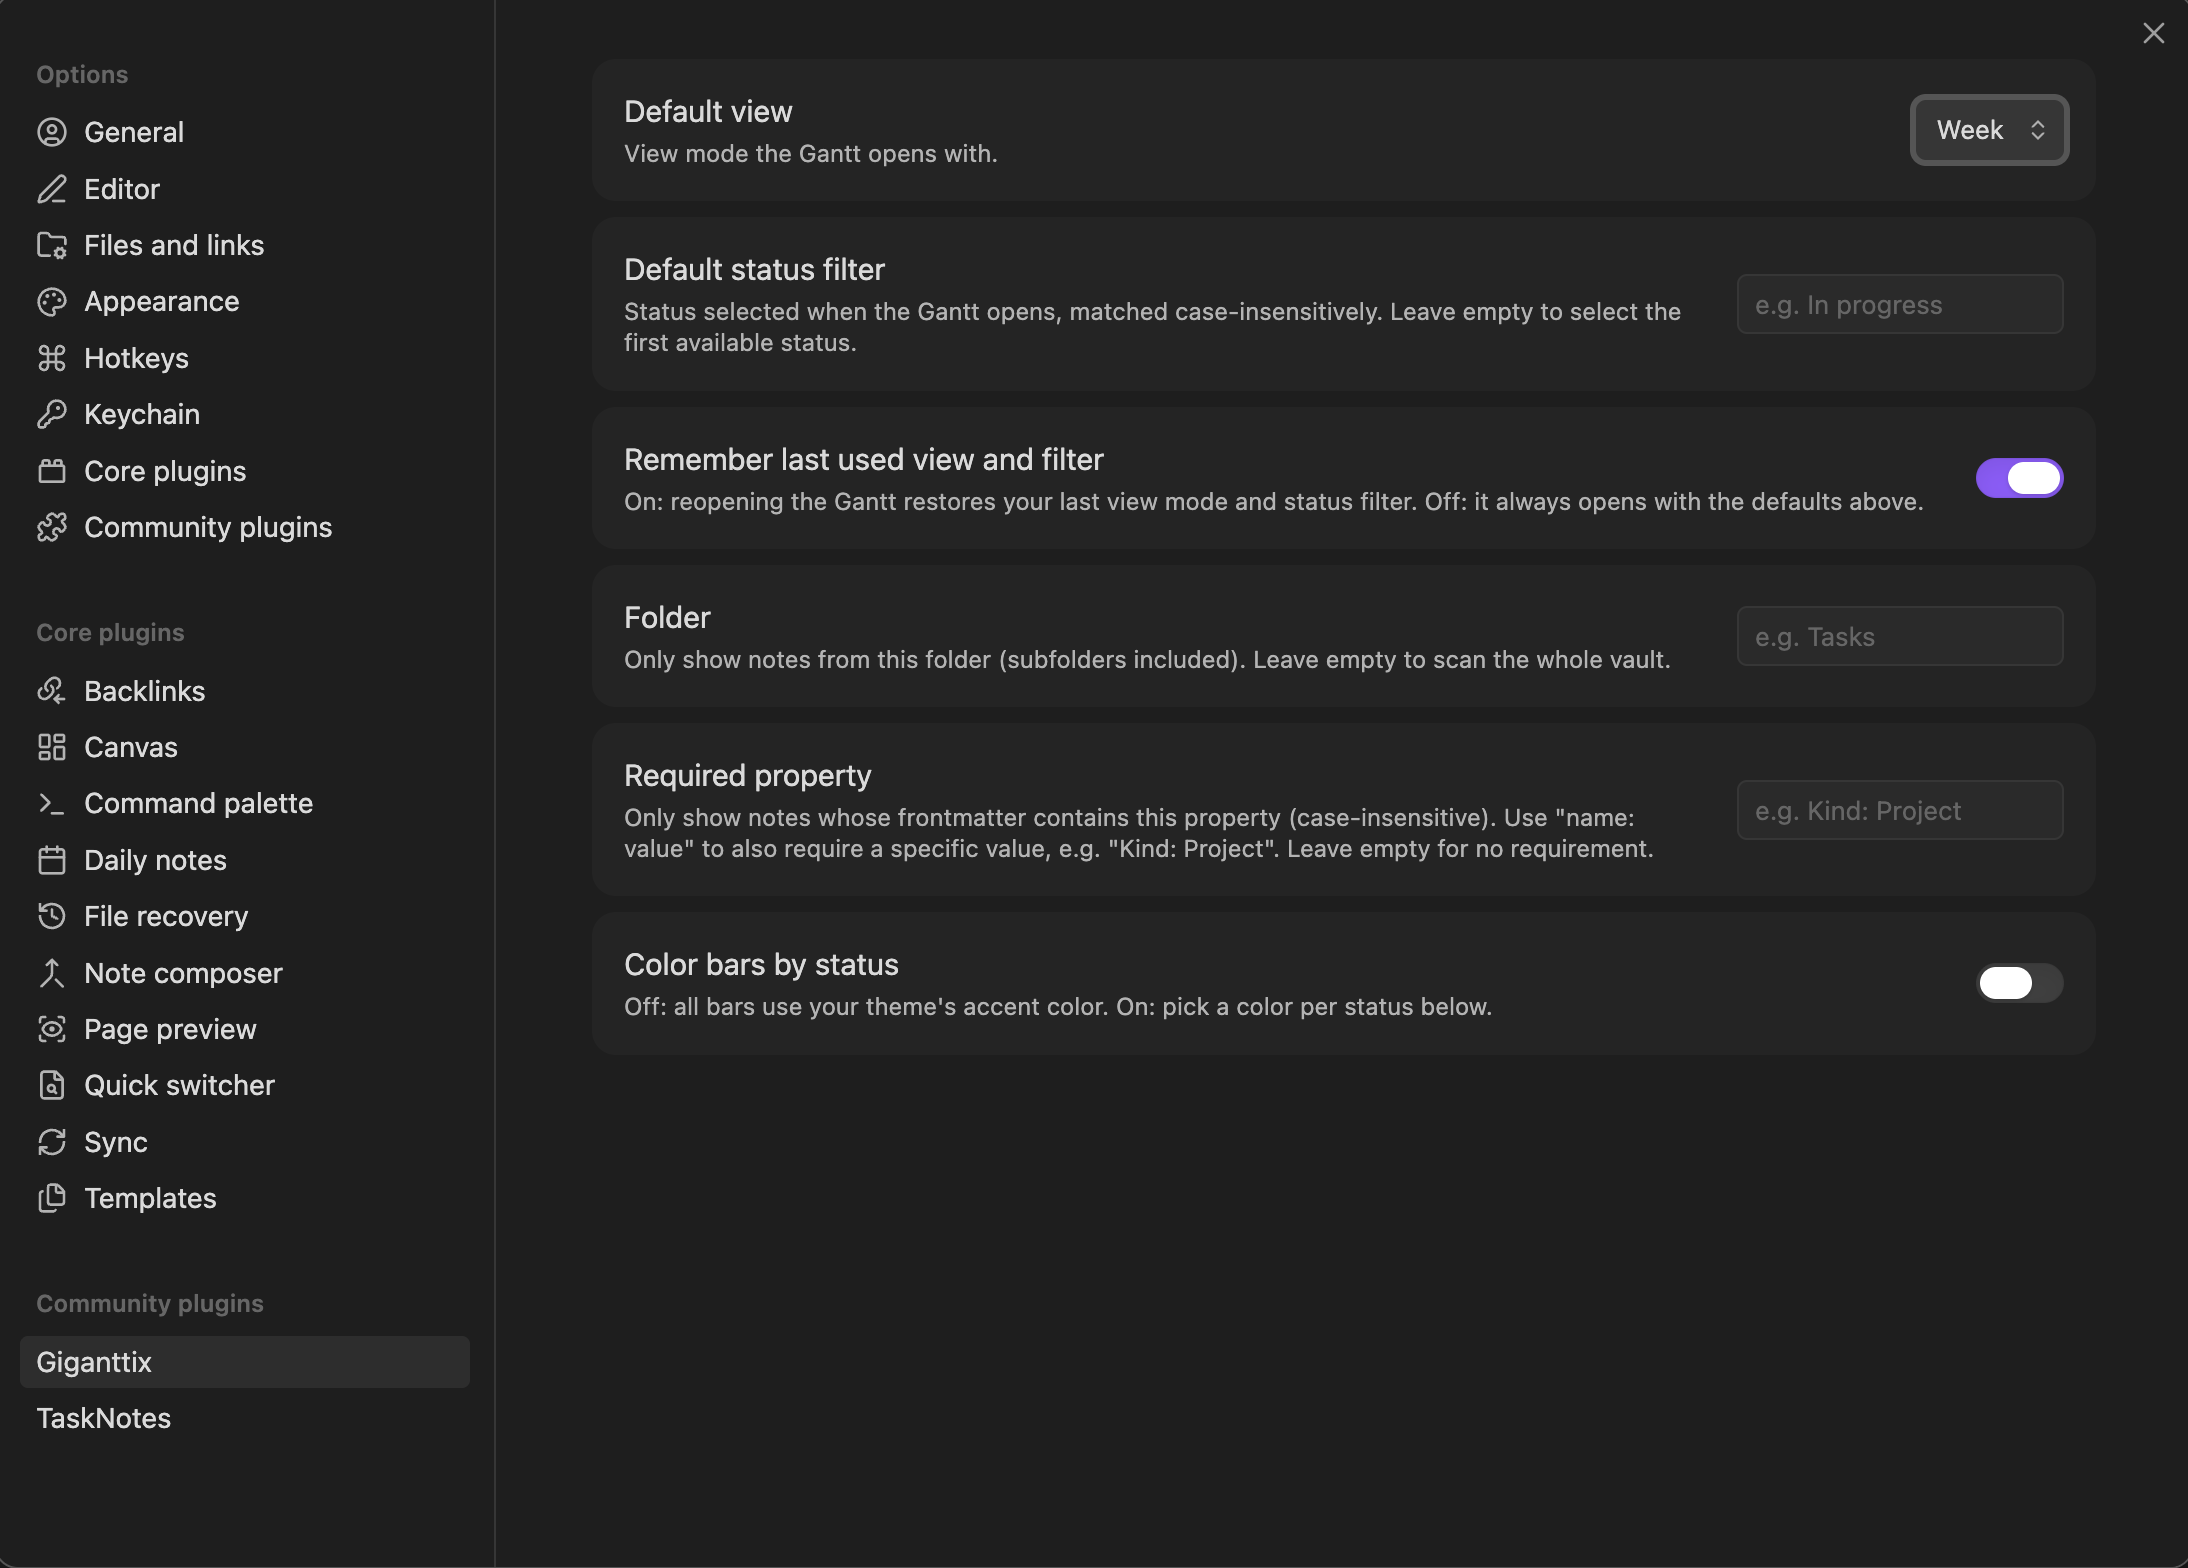
| Setting | What it does |
|---|---|
| Default view | Day, Week or Month on open |
| Default status filter | Status selected on open (case-insensitive); empty = first available |
| Remember last used view and filter | On: reopening restores your last state. Off: always open with the defaults |
| Folder | Only show notes from this folder (subfolders included); empty = whole vault |
| Required property | Only show notes that have this frontmatter property, e.g. projects |
| Start date property | Frontmatter property read for the start date; empty = startDate |
| End date property | Frontmatter property read for the end date; empty = endDate |
| Project property | Frontmatter property to group tasks by project; empty = no project filter |
| Statuses | Statuses always offered in the right-click menu, in your order |
| Color bars by status | Off: theme accent color. On: per-status color pickers |
Installation
Community plugins: Settings → Community plugins → Browse → search "Giganttix".
Notes and limitations
- Desktop only for now.
Acknowledgements
Built with TypeScript and esbuild on top of Frappe Gantt (MIT). Developed with Claude Cowork (Anthropic).