
README file from
GithubFieldForge
Visual property explorer for Obsidian. Pick frontmatter fields and forge them into pivot tables and charts — no Dataview queries needed.


Why
Most dashboard tooling in Obsidian (Dataview, Dashboard Plus, …) is query-centric: you write a query, then render it. FieldForge flips that — you just pick fields:
- Rows — group by any frontmatter property or a file field (folder, tags, created, …)
- Columns — pivot a second property into columns (optional)
- Values — count files, or aggregate a numeric property (sum / avg / min / max / distinct)
The view re-forges instantly on every change. No query syntax, no code blocks.
Screenshots
 |
 |
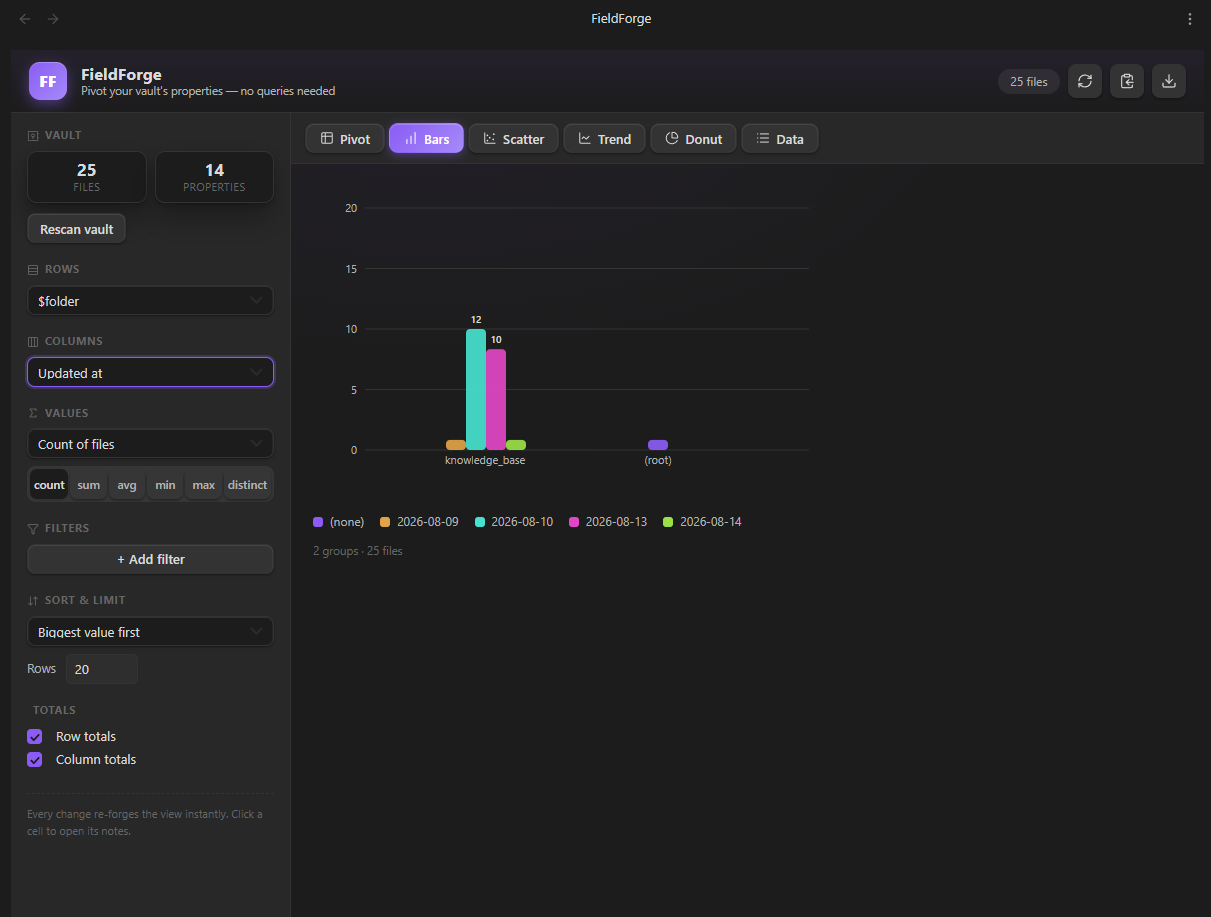
| Pivot table with heatmap cells | Grouped bar chart |
 |
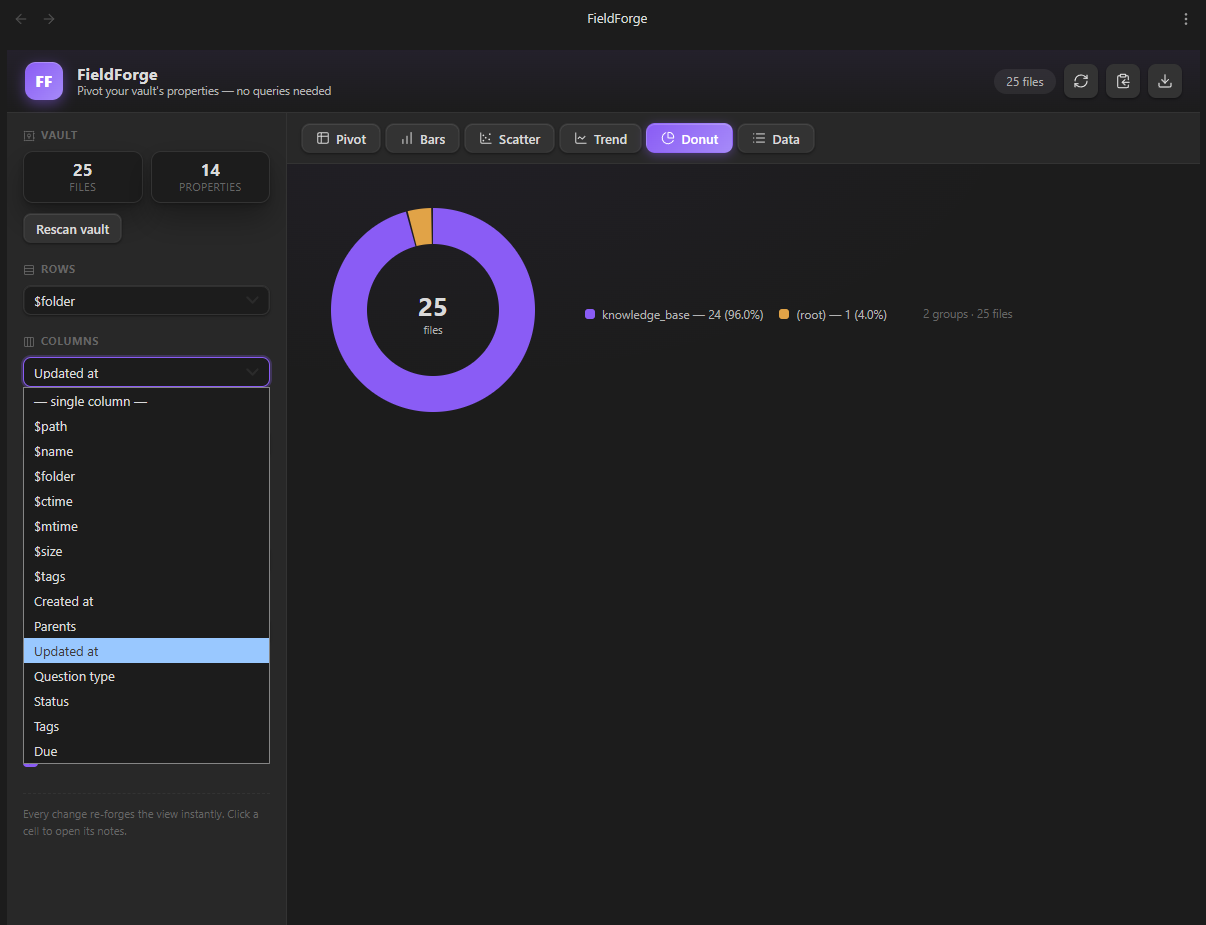 |
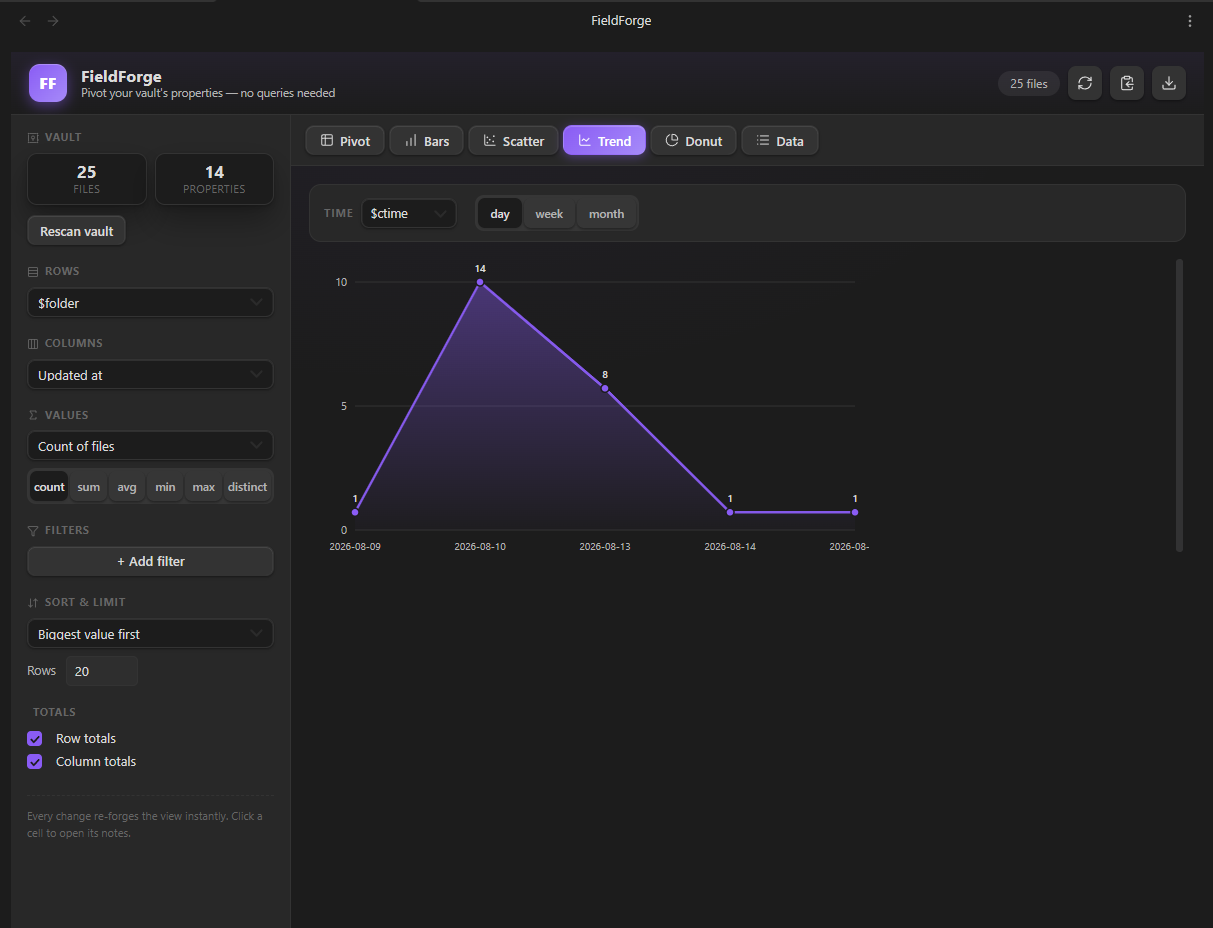
| Files created over time | Share of totals per group |
Features
- Pivot table with per-column heatmap coloring, row/column totals, hover tooltips listing the files in each cell, and click-to-open-note
- Bar chart — single-series or grouped by columns, with value labels and hover tips
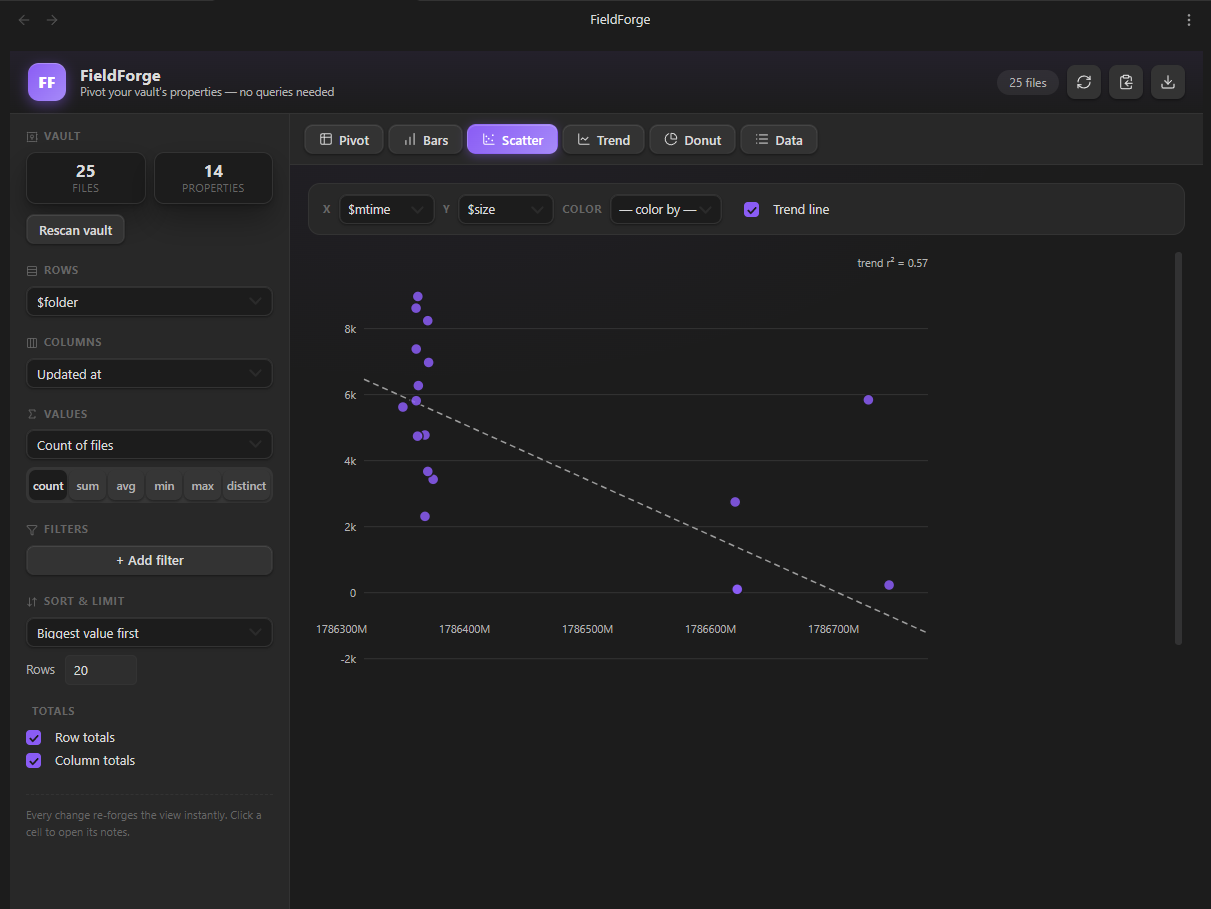
- Scatter plot — any two numeric/date properties, color-coded by a category, with an optional least-squares trend line (r² shown)
- Trend chart — file counts over time (day / week / month buckets) as an area chart
- Donut chart — share of totals with legend
- Data grid — searchable raw table, toggle columns with chips, click to open
- Filters — equality, ≠, contains, >, <, exists, is empty
- Export — copy the current view as a Markdown table or download CSV
- Auto-refresh — the view rebuilds itself (debounced) as you edit your vault
- Theme-native — built entirely on Obsidian design tokens; adapts to any theme, light and dark, desktop and mobile
Install
- Build (requires Node 18+):
cd fieldforge npm install npm run build - Copy the folder into your vault:
(the folder must contain<your-vault>/.obsidian/plugins/fieldforge/main.js,manifest.json, andstyles.css) - In Obsidian: Settings → Community plugins → enable FieldForge (toggle "Restricted mode" off first if needed).
- Click the table icon in the left ribbon, or run FieldForge: Open FieldForge from the command palette.
Usage tips
- Start with Rows = Folder and Values = Count of files to see your vault at a glance.
- To compare two properties (e.g. Type × Status), set Rows and Columns, then click the Bars tab.
- The Scatter tab needs numeric fields — pick e.g.
Created × Wordsand color byType. - Click any pivot cell to jump to the note behind the number.
Development
npm run dev        # watch mode (esbuild)
npm run typecheck  # tsc --noEmit
npm run build      # typecheck + production bundle
Structure
src/
├── main.ts            # plugin entry: ribbon, commands, view registration
├── view.ts            # view shell: header, tabs, canvas, config state
├── data/
│   ├── schema.ts      # types, built-in fields, value helpers
│   ├── scanner.ts     # vault scan via metadata cache
│   └── pivot.ts       # filter → bucket → aggregate engine
└── ui/
    ├── controls.ts    # sidebar: field pickers, aggregation, filters
    ├── pivotTable.ts  # heatmap table + markdown/CSV export
    ├── dataGrid.ts    # searchable raw table + export
    └── charts.ts      # dependency-free SVG charts (bar/scatter/trend/donut)
preview.html is a standalone design mock — open it in any browser to see the UI
(light/dark toggle included) without running Obsidian.
License
MIT © 2026 Kerekes Stefan