
README file from
GithubData Charts for Obsidian
Interactive, responsive charts of the data files in your vault — CSV, JSON and JSON Lines — written as a small YAML block in any note.
- Any x axis: dates (a time axis), numbers or names, detected from the data.
- Range buttons:
1W,1M,3M,6M,1Y,3Y,YTD,Allon a time axis; the last N units or categories, or named windows, on any axis. Buttons that would show everything are left out. Charts of agroupin a note share their range. - Zoom and pan: ⌘/Ctrl + wheel, trackpad or touch pinch, drag, and a slider.
- Series: lines, areas, bars, points, stacked bars with their total; moving averages by points or by time (
7d); aggregation by day, week, month or year; expressions (distance_km * 1000 / (hr_avg * duration_min)). - A readable time axis: days, weeks, months or years as the window and the width allow; the first label of each month names it, hairlines mark where months begin, and weekly or monthly totals are labelled under their bar.
- Descriptions: a few lines of Markdown under the title, to say what the chart shows and how to read it.
- Reference bands: a green range from two fields of each row (lab reference intervals) or two numbers (a target); points outside it are red triangles pointing up or down, and the tooltip says so.
- Small multiples:
facetdraws one chart per value of a field (one per lab test, per sport…), zooming together. - Tables: a table view of every chart, and
type: tablefor rows filtered by the note itself (where: date == this.Date). - Live: a chart redraws when its files change — an import running in the background updates the note you are reading.
- Theme: colors, fonts and dark mode follow Obsidian; a color-blind-safe palette; works on iPhone and iPad.
- Weather: a
data-weatherblock shows the forecast for a place and a span of days — a trip, a race, an event — and updates itself; days still too far ahead show their typical weather.
Data files are read from the vault and never leave it. Only weather blocks use the network: see Weather.
The screenshots show Obsidian's default theme and synthetic data.
Installation
Download main.js, manifest.json, styles.css from a published
GitHub release.
Inside your vault's configuration folder (normally .obsidian), create
plugins/data-charts/ and put those files directly inside it. Reload Obsidian,
then enable Data Charts under Settings → Community plugins.
Each plugin can be installed on its own; no companion plugin or personal vault is required.
The minimum Obsidian version is 1.5.0. The plugin supports desktop and mobile. After the plugin is accepted into the community directory, it will also be available through Obsidian's built-in plugin browser.
A first chart
```data-chart
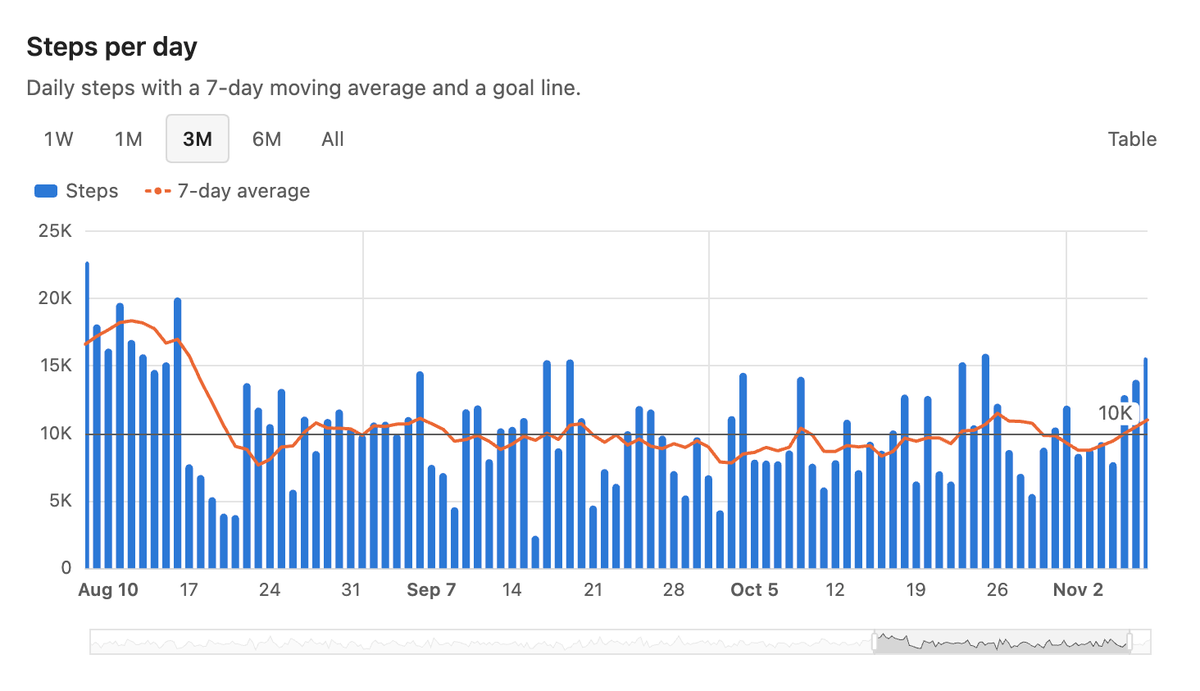
title: Steps per day
description: Daily steps with a 7-day moving average and a goal line.
source: Data/daily.csv
x: date
range: 3M
series:
  - {y: steps, name: Steps, type: bar, goal: 10000}
  - {y: steps, name: 7-day average, rolling: 7d}
```
Data/daily.csv:
date,steps
2026-03-01,8123
2026-03-02,10456
The block
| Key | Example | |
|---|---|---|
source |
File, list of files, or pattern (* within a folder, ** across folders), from the vault's root. .csv, .tsv, .json (an array, or the first array of objects in the file), .jsonl |
Data/Runs/*.jsonl |
x |
Field of the horizontal axis; {field: t, type: value} to force time, value or category |
date |
y |
One series: a field or an expression. For more, series |
weight_kg |
series |
List of series, each with y and any series key below |
|
type |
line (default), area, bar, scatter, or table |
bar |
title |
Shown above the chart | |
description |
Markdown under the title: what the chart shows, how to read it | Minutes in each zone, per week. |
where |
Keeps the rows for which the expression holds | sport == "running" |
range |
Range shown first | 3M |
ranges |
Range buttons, replacing the default ones | [1W, 1M, 1Y, All] |
group |
Charts of the note with the same group share their range | running |
facet |
One chart per value of this field | analyte |
facets |
Which values, in which order | [hemoglobin, ferritin] |
labels |
Names shown for facet values | {ferritin: Ferritin (ng/mL)} |
yaxis |
min, max, zero (include zero), log, unit (shown above the axis; by default the unit all series share), inverse (upside down: for a pace, lower is faster), format: duration (values in seconds, shown as 5:30) |
{zero: true} |
colors |
A list, one color per series: names of the palette (blue, orange, aqua, yellow, magenta, green, violet, red), which take their dark step on dark themes, or CSS colors; or sequential: one hue from light to dark, for ordered series |
[blue, aqua, yellow] |
height |
Pixels, 120–2000 (default 300) | 240 |
columns, sort, limit |
For type: table: fields shown, order (-date or date desc), number of rows |
Series keys — also accepted at the top level, for every series:
| Key | Example | |
|---|---|---|
name |
Legend and tooltip | Resting heart rate |
type |
line, area, bar, scatter |
|
rolling |
Moving average: a number of points, or a time window | 7, 7d, 4w |
agg |
Aggregation: bucket/function on a time axis (buckets day, week, month, year), or a function alone to merge equal x. Functions sum, avg, min, max, last, count |
week/sum |
band |
Two fields, expressions or numbers: the range where values are expected, in green; values outside are red triangles, up when above and down when below | [low, high], [7, 9] |
goal |
A horizontal line | 10000 |
points |
Show every point (default: when there are at most 40) | true |
smooth |
Smooth the line | true |
unit |
After values in the tooltip | kg |
color |
A palette name or a CSS color, instead of the palette's next one | violet |
stack |
Bars (or areas) drawn on top of each other: true, or a name for each stack; the tooltip adds the total |
true |
There is never a second y axis: two measures of different scale go in two charts, which a group keeps on the same range.
Ranges
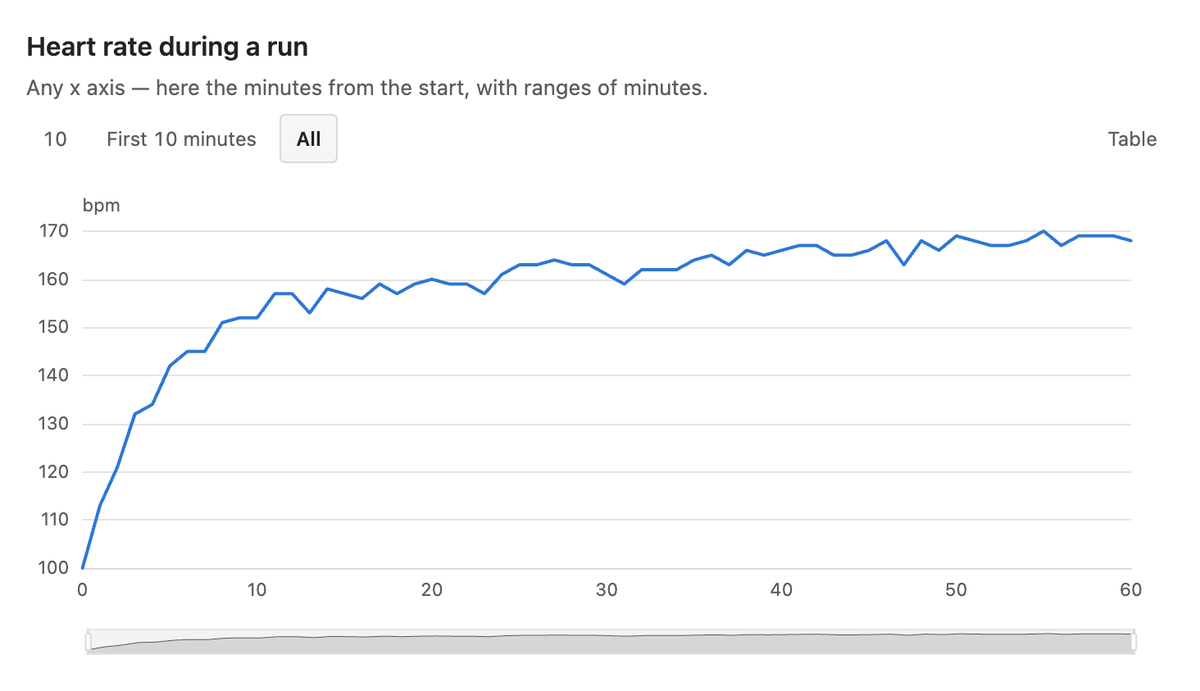
On a time axis, a range counts back from the latest date: 12h, 7d, 2w, 3m (months), 1y, and YTD, All. On any axis, a number is the last N units of x (or the last N categories), and {label: [from, to]} is a fixed window:
title: Heart rate during a run
source: Data/Runs/2026-03-02.jsonl
x: t
y: hr
name: Heart rate
unit: bpm
ranges: [10, {First 10 minutes: [0, 10]}, All]
Expressions
where, y and band take expressions: fields, numbers, "strings", + - * / %, == != < <= > >=, and or not (or && || !), in [..], parentheses. Dates in ISO format compare as text. this.<property> is a property of the note holding the chart; a link [[Note]] compares as Note. Names with spaces go in backticks: `End Date`.
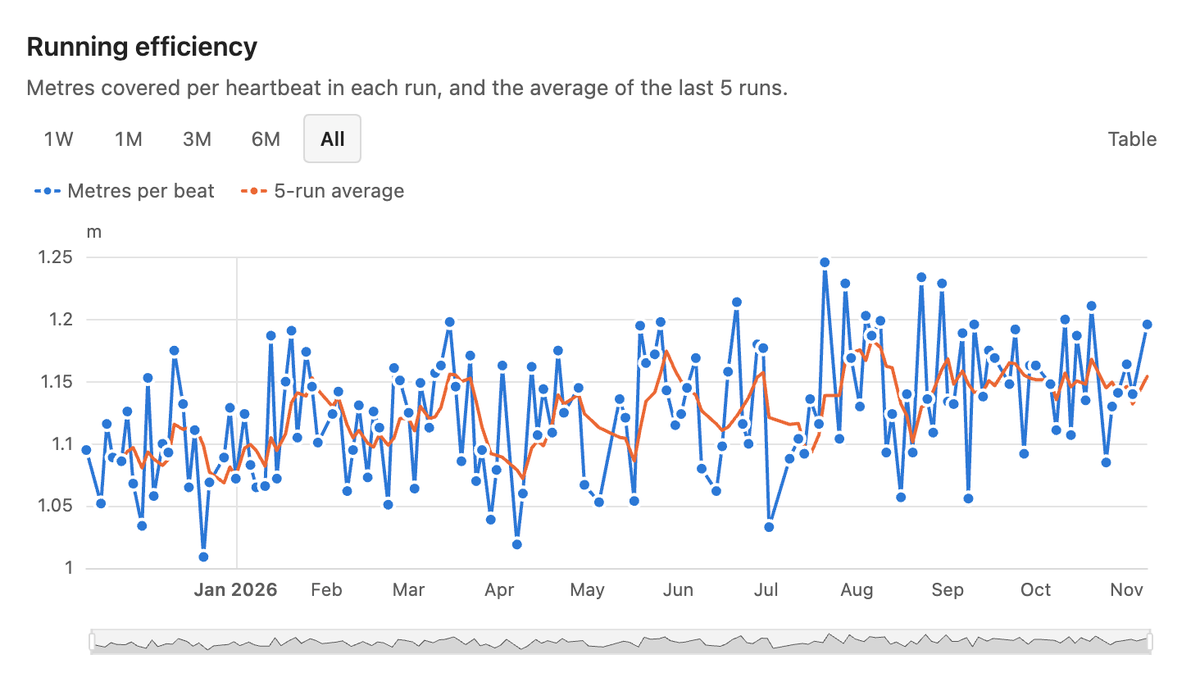
title: Efficiency — metres per heartbeat
source: Data/workouts.jsonl
where: sport == "running" and distance_km >= 2
x: date
series:
  - {y: distance_km * 1000 / (hr_avg * duration_min), name: m per beat, points: true}
  - {y: distance_km * 1000 / (hr_avg * duration_min), name: 5-run average, rolling: 5}
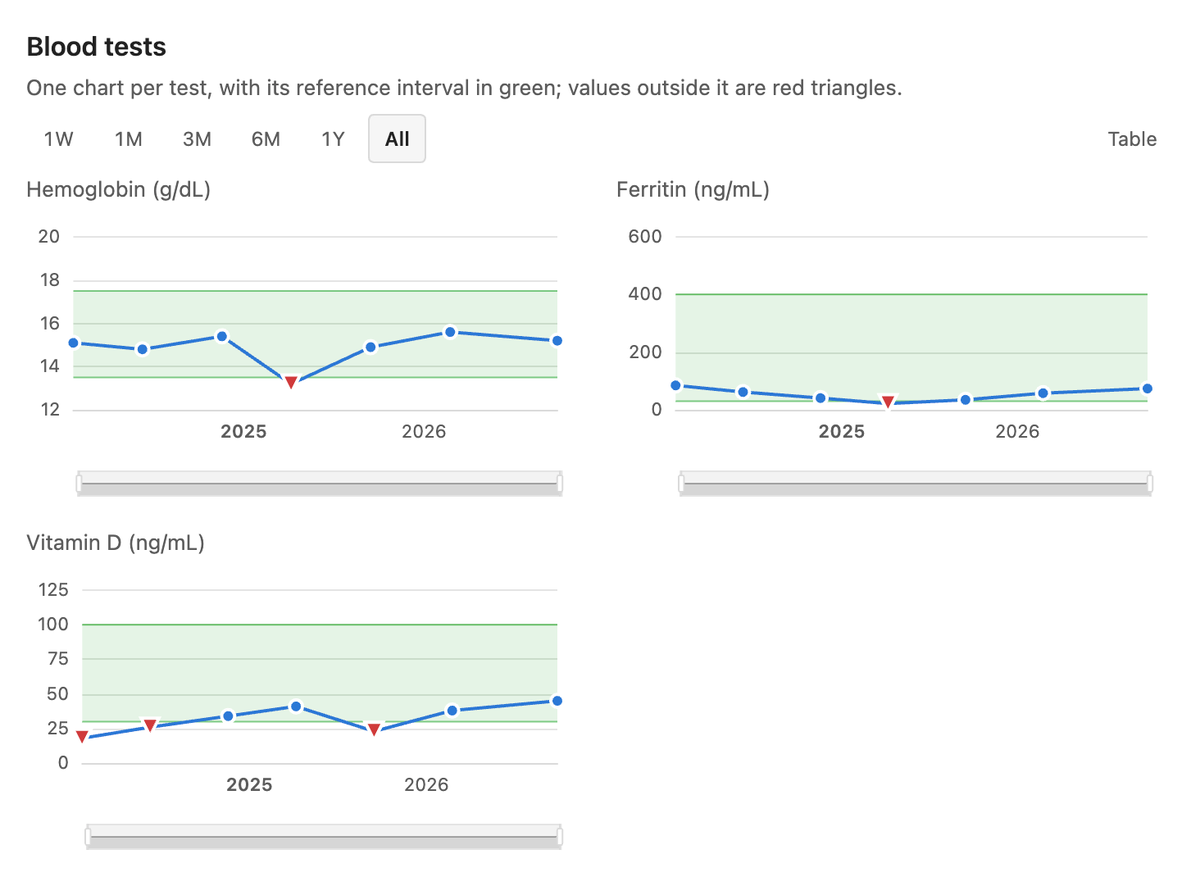
Lab results with reference bands
title: Blood tests
description: One chart per test, with its reference interval in green; values outside it are red triangles.
source: Data/labs.jsonl
x: date
y: value
band: [low, high]
facet: analyte
facets: [hemoglobin, ferritin, vitamin_d]
labels: {hemoglobin: Hemoglobin (g/dL), ferritin: Ferritin (ng/mL), vitamin_d: Vitamin D (ng/mL)}
points: true
range: All
And in the note of one report, its values:
type: table
source: Data/labs.jsonl
where: date == this.Date
columns: [analyte, value, unit, low, high, flag]
sort: analyte
Weekly totals
title: Kilometres per week
source: Data/workouts.jsonl
where: sport == "running"
x: date
y: distance_km
type: bar
agg: week/sum
unit: km
range: 6M
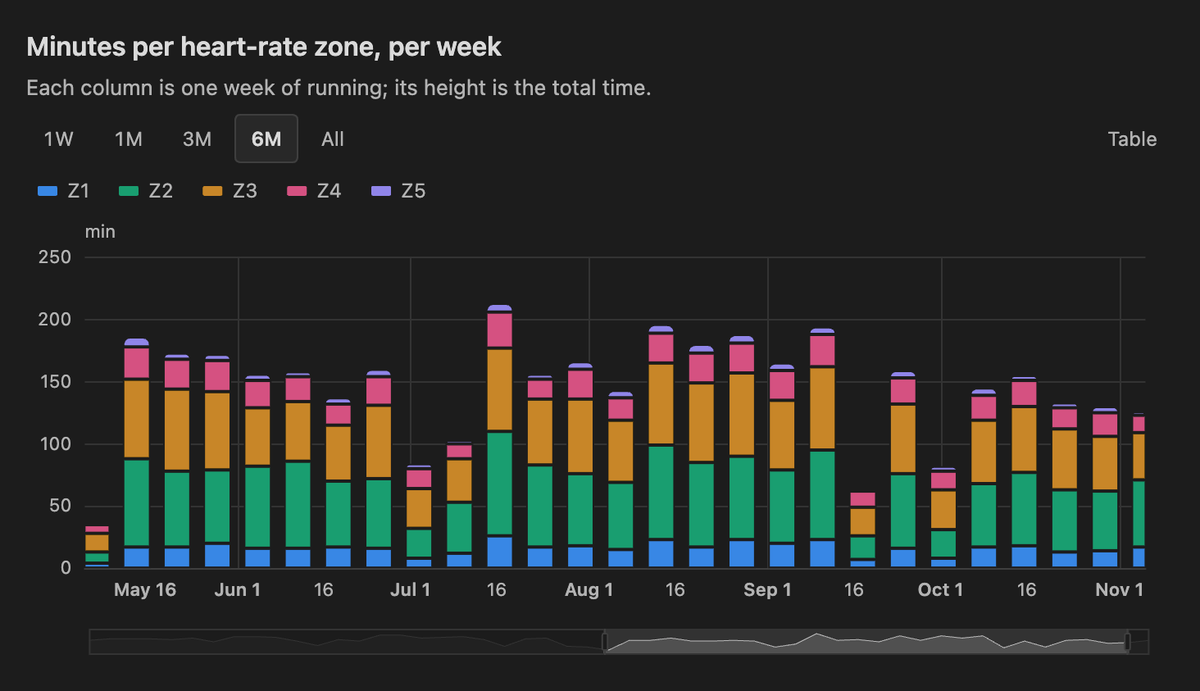
Stacked totals
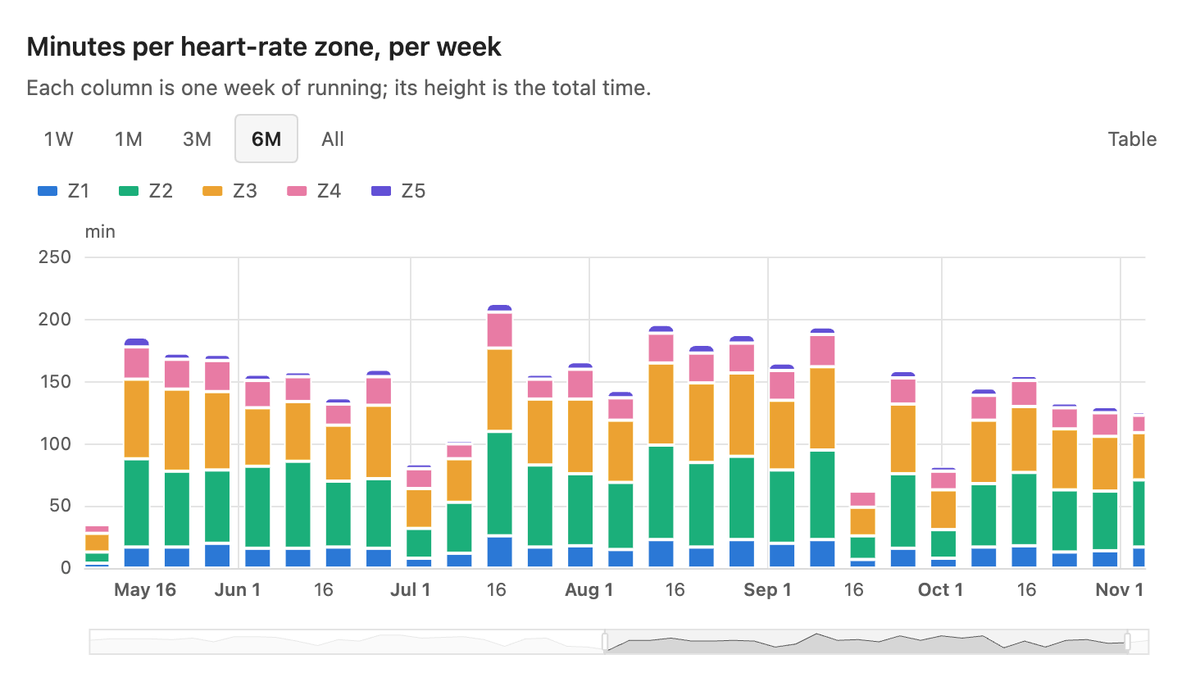
title: Minutes per heart-rate zone, per week
description: Each column is one week of running; its height is the total time.
source: Data/workouts.jsonl
where: sport == "running"
x: date
range: 6M
type: bar
agg: week/sum
stack: true
colors: [blue, aqua, yellow, magenta, violet]
unit: min
series:
  - {y: z1_min, name: Z1}
  - {y: z2_min, name: Z2}
  - {y: z3_min, name: Z3}
  - {y: z4_min, name: Z4}
  - {y: z5_min, name: Z5}
The same chart in a dark theme: colors take their dark steps.
A pace, in minutes and seconds
title: Pace
source: Data/workouts.jsonl
where: sport == "running"
x: date
y: pace_s_km
name: Pace
unit: /km
yaxis: {inverse: true, format: duration}
points: true
Weather
A data-weather block shows, for each day, the sky, the highest and lowest temperature, the chance and amount of rain, the strongest wind, and sunrise and sunset; for days too far ahead, their typical weather. The forecast comes from Open-Meteo, free and without a key.
place: Edinburgh
from: 2026-12-04
to: 2026-12-07
In the note of a trip, the block can read the note's properties with this.: a link or a list of links gives the name of the first place.
title: Weather in Edinburgh
place: this.Places
from: this.Date
to: this.End Date
| Key | Value |
|---|---|
place |
A city or another place, looked up by name; a link such as [[Edinburgh]] works too. |
country |
An ISO 3166-1 alpha-2 code, when the name is ambiguous (Paris with country: US). |
latitude, longitude |
Instead of a lookup; place is then only the name shown. |
from, to |
The first and last day, YYYY-MM-DD (a time after the day is ignored). Without from, today. |
days |
Instead of to: how many days from from; 7 by default. days: 3 gives today and the next two days. |
units |
metric (°C, mm, km/h, the default) or imperial (°F, inch, mph). |
title |
Shown above the table; the place's name, region and country by default. |
A forecast reaches 15 days after today. Days further ahead show, in grey, their typical weather: the average of the same days over the last ten years, from Open-Meteo's archive, where Rain is the share of those days with at least 1 mm (0.04 inch). A line under the table says from which day the forecast replaces them. The block asks again every hour and whenever the note is opened, so a trip fills in with forecasts as it comes closer. Days that have passed keep their weather for about three months.
Network use. To show a weather block, the plugin sends the name of the place to Open-Meteo's geocoding service, and the coordinates and days to its forecast and archive services. Nothing else leaves the device. Forecasts are kept for an hour (the archive for a month) in memory and, so that they are still there offline, in the device's local storage; nothing is written to the vault. Weather data by Open-Meteo.com, under CC BY 4.0; the block says so under its table.
Design
Marks are thin and quiet: 2px lines, 8px points with a ring in the background color, bars at most 24px wide with rounded ends, fills at 10 %, a hairline grid, a legend only for two or more series. Series take a fixed order of eight colors chosen to stay distinct for color-vision deficiencies, with their own steps for dark themes; ordered series (colors: sequential) take steps of one blue instead, from the lightest to the darkest (the reverse on dark themes). Stacked bars are separated by a hairline of the background and rounded only at the top of each column. Text uses the theme's text colors, never a series color. Tooltips list every series at the x under the pointer, value first. Every chart has a table view.
Privacy
Charts read files and properties in the current vault; the plugin does not read
files outside it or upload chart data. It has no telemetry and needs no paid
account or API key. Only data-weather blocks use the network, as described in
Weather below. No weather request is made unless a weather block is rendered.
Development
npm ci
npm run lint
npm test
npm run typecheck
npm run build      # dist/main.js; with VAULT_PLUGIN_DIR=<vault>/.obsidian/plugins/data-charts, also installed there
src/ holds the logic and knows nothing of Obsidian or of the chart library: the expression language (expr.ts), the block (spec.ts), files and series (data.ts), ranges (ranges.ts), the labels of a time axis (timeaxis.ts), the ECharts option (option.ts) and the weather block (weather.ts); src/obsidian/ draws with Apache ECharts, importing only the parts it uses. The tests run with Node's test runner; the examples of this README are among them. MIT license.
Support and licence
Report bugs and request features in this repository's Issues, including your Obsidian version, operating system, plugin version and a minimal example with synthetic data. Please leave private notes and personal data out of reports.
MIT licence; see LICENSE. Bundled dependencies retain their own licences; see third-party attribution. Release preparation and the manual community-directory submission are described in PUBLISHING.md.